
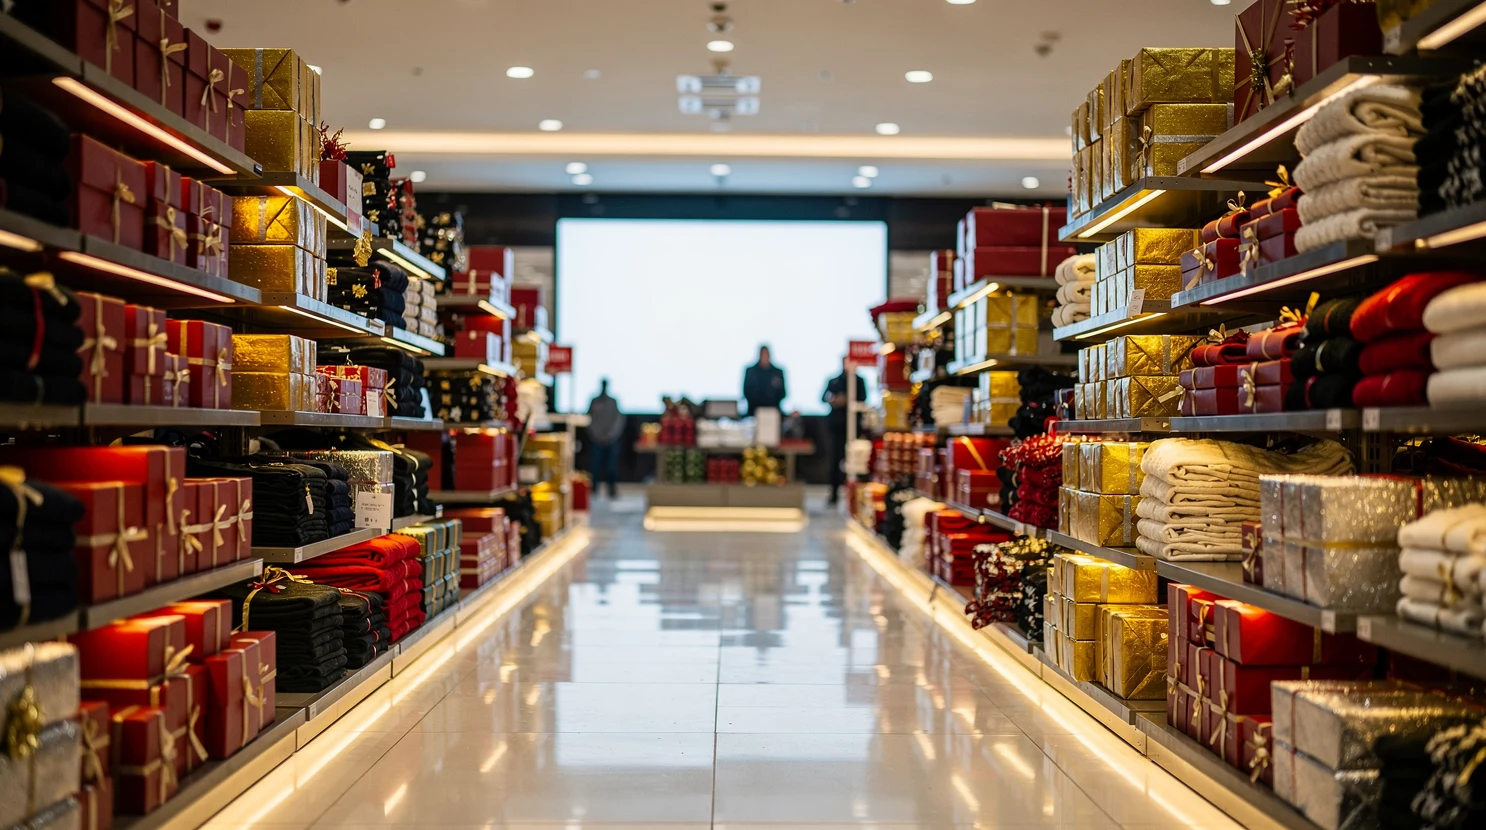
US retailers are heading into a holiday season that will, on Bain & Company’s numbers, cross a threshold the industry has never crossed before. The consultancy expects November and December retail sales to exceed USD 1 trillion for the first time, on nominal growth of 4.5% year over year. Retail Dive reported the forecast on September 8, following Bain’s own release of the 2026 Holiday Shopping Outlook on September 3.
The milestone is real, and so is the qualifier attached to it. Bain states that more than half of that nominal growth comes from higher prices rather than higher volumes. Strip inflation out and the season looks closer to ordinary than record-breaking. That gap between the headline and the underlying trade is the story that matters for anyone pricing inventory, buying media, or booking parcel capacity between now and late December.
In short
- USD 1 trillion, first time: Bain forecasts US November to December retail sales above USD 1 trillion, up 4.5% year over year, against 3.5% growth in the 2025 season.
- Most of the growth is price: Bain attributes more than 50% of the nominal increase to inflation, with headline inflation at 3.4% running ahead of nominal wage growth at 3.1%.
- Online does the lifting: nonstore sales are forecast to grow 9% against 2.5% in stores, and to supply 60% of total growth, up from about 50% a year earlier.
- Tariff refunds enter the pricing conversation: Bain notes several retailers plan to pass tariff refunds through as lower prices, following the Supreme Court’s February 2026 ruling against tariffs imposed under the International Emergency Economic Powers Act.
- AI moves into discovery: 24% of surveyed consumers plan to start holiday shopping on an AI platform, up from 17% in 2025, with a further 13% expecting to use retailer-operated AI agents.
What Bain actually forecast for the 2026 holiday season
Bain’s 2026 Holiday Shopping Outlook projects US retail sales of more than USD 1 trillion across November and December, representing 4.5% nominal growth against the same two months of 2025. That compares with 3.5% growth recorded in the 2025 holiday season, so the forecast implies an acceleration rather than a slowdown.
Within that total, Bain splits the channels sharply. In-store sales are forecast to rise 2.5%. Nonstore sales, which cover e-commerce and mail order, are forecast to rise 9%. In-store still accounts for close to 70% of the seasonal total, which is why a modest in-store number still dominates the aggregate.
The consumer research behind the forecast comes from the Bain Consumer Lab Holiday Survey 2026, run in partnership with ROI Rocket, with a US sample of 1,105 respondents. The prior year’s comparison sample was 950. Respondents were able to select multiple answers on several questions, which matters when reading the channel and category percentages.
The base Bain is measuring
Definitions do most of the work in holiday forecasting, and Bain is explicit about its own. The firm measures US retail sales as unadjusted in-store and nonstore sales, excluding sales by auto and auto parts dealers, gas stations, and restaurants. Historical data and forecasts are not seasonally adjusted.
Three exclusions carry weight. Removing gas stations strips out the most volatile price line in the retail complex, which is significant in a season where energy costs have been moving. Removing restaurants excludes a large slice of discretionary spending that competes directly with gift budgets. Removing auto dealers removes a category whose average ticket can swamp everything else.
Anyone comparing this forecast with another firm’s number needs to check the base first. A forecast covering November through January, or one that includes food service, is not measuring the same thing, and the resulting percentages are not interchangeable.
Why the USD 1 trillion headline is a definitional milestone
A trillion-dollar two-month season is a genuine first on Bain’s series, and it will be quoted through the fourth quarter. It is worth being precise about what it does and does not signify.
The number is nominal. It is measured in current dollars, so it rises when prices rise even if the same number of units leaves the shelf. It is also a two-month, not a full-quarter, figure, and it excludes three large retail categories. On the same basis, Bain’s 2025 outlook projected roughly USD 975 billion at about 4% growth, so this year’s crossing of the trillion mark was already close on the previous trajectory.
The practical read is that the milestone marks the arithmetic of price levels catching up with an already large base, not a demand surge. Aaron Cheris, partner and global head of the retail practice at Bain & Company, framed it directly in the firm’s release: “While US retailers have reason to rejoice this holiday season as the industry reaches the trillion-dollar milestone for the first time, there are underlying factors that will temper bottom lines.”
How much of the growth is real: the inflation split
Bain’s most consequential line is not the trillion. It is the attribution: more than half of the nominal sales growth comes from higher inflation, which pushes up prices for consumers. That single sentence reframes the whole forecast.
If more than 50% of a 4.5% nominal increase is price, the residual real growth sits somewhere near or slightly above 2%. That is a respectable but unremarkable volume result, and it is a very different planning input from a 4.5% headline. Buyers who size inventory off the nominal number risk carrying units that only clear on markdown.
| Metric | 2026 holiday forecast | 2025 holiday |
|---|---|---|
| Total nominal growth | 4.5% | 3.5% |
| In-store growth | 2.5% | Not stated in the 2026 release |
| Nonstore growth | 9% | Not stated in the 2026 release |
| Share of growth from nonstore | 60% | About 50% |
| Share of nominal growth from inflation | More than 50% | Not stated in the 2026 release |
| Total season value | Above USD 1 trillion | Below USD 1 trillion on the same base |
Headline versus core inflation
Bain cites headline inflation at 3.4% against nominal wage growth of 3.1%, which means average pay is losing ground to average prices. It then notes that core inflation, excluding gas and energy, runs at 2.5%, which is below wage growth.
The two measures point in opposite directions for household budgets, and the gap between them is the energy line. Households feel the 3.4% at the pump and on the utility bill. The general merchandise basket that competes for gift spending is closer to the 2.5% figure.
That distinction has already been visible in how retailers talk about costs this quarter. Our earlier analysis of why fuel and energy costs are outranking tariffs in retail guidance tracks the same shift in the cost narrative that Bain’s split between headline and core inflation describes.
What a 2.5% real-growth season looks like on the shop floor
Low single-digit real growth does not feel like a record season inside a store. Traffic looks flat, baskets look similar, and the sales line rises mainly because tickets are larger.
It also compresses the margin story. When price carries the top line, gross margin depends on whether cost inflation was absorbed upstream or passed through cleanly, and on how much of the season clears at full price.
Retailers that plan promotional depth off nominal growth tend to over-promote into a season like this. The safer approach is to plan units off real growth and treat the price effect as a margin question rather than a demand signal.
Why online is doing the work: 9% versus 2.5%
The channel gap in Bain’s forecast is the widest structural feature of the number. Nonstore growth at 9% runs at roughly 3.6 times the in-store rate of 2.5%. That is not a marginal difference in trajectory; it is a different growth regime for the same season.
Because in-store still represents nearly 70% of the total, the aggregate stays anchored by physical retail. But the direction of travel is unambiguous, and it is accelerating rather than stabilising.
The 60% growth-share shift
Bain reports that nonstore sales will drive 60% of overall sales growth, up from about 50% a year earlier. That ten point shift in a single season is the number to watch, because growth share is what determines where incremental investment goes.
Consumer intent in the survey lines up with it. Some 40% of respondents plan to split spending roughly evenly between online and in-store, 24% expect to shop mostly online, and 13% expect to shop mostly in-store. Shopping on retailer and brand websites rose to 60% from 51% in 2025.
A 9% online season also lands directly on fulfillment economics, since every incremental online order carries a pick, a pack, and a parcel. Peak surcharges and general rate increases decide whether that incremental revenue converts to profit, and our breakdown of why peak 2026 parcel costs are likely to outrun the headline rate increase sets out how the effective cost per parcel can move well beyond the published percentage.
What tariff refunds change about holiday pricing
The most distinctive pricing variable in this particular season is not a promotion calendar. It is a refund flow. Bain notes that several retailers plan to pass tariff refunds to shoppers as lower prices, which turns a customs administration process into a merchandising input.
The refunds trace back to the Supreme Court’s February 20, 2026 decision holding that the International Emergency Economic Powers Act does not authorize the president to impose tariffs. The ruling, decided 6 to 3 in the consolidated cases Trump v. V.O.S. Selections and Learning Resources, Inc. v. Trump, invalidated the IEEPA tariff program and opened the question of what happens to duties already collected.
The CAPE refund timetable
US Customs and Border Protection built a consolidated electronic mechanism inside the Automated Commercial Environment to process the refunds at scale, known as CAPE. Phase 1 launched on April 20, 2026, limited to certain unliquidated entries and certain entries liquidated within 80 days of the submission date. Phase 2, covering entries flagged for Reconciliation where no Reconciliation entry had been filed, opened on June 29, 2026.
On the government’s own representations reported in trade counsel advisories, more than USD 95 billion has been queued for refund through CAPE, with more than USD 40 billion expected to have been disbursed by the end of June 2026. Importers must be registered with electronic payment details on file, and disbursement rolls out over time rather than arriving in a single settlement.
| Stage | Date | Scope |
|---|---|---|
| Supreme Court decision | February 20, 2026 | IEEPA held not to authorize tariffs, 6 to 3 |
| CAPE Phase 1 | April 20, 2026 | Certain unliquidated entries; entries liquidated within 80 days of submission |
| CAPE Phase 2 | June 29, 2026 | Entries flagged for Reconciliation with no Reconciliation entry filed |
| Disbursement status | End of June 2026 | Over USD 95bn queued; over USD 40bn represented as disbursed |
The sector tariffs that did not go away
A refund on IEEPA duties is not a general tariff reprieve, and this is where retail pricing gets complicated. Section 232 sectoral tariffs sit on a separate legal footing and remain in force.
Duties on steel, aluminum and copper continue to run. Tariffs of 25% on wood products and furniture categories remain a live cost for home and furnishing retailers. Section 232 tariffs of 100% on patented pharmaceutical products and their active ingredients took effect on July 31, 2026 for companies named in Annex III of the proclamation, with September 29, 2026 as the effective date for other manufacturers. Generics and biosimilars are expressly excluded at this stage.
Low-value import rules are also unchanged by the refund process. The de minimis exemption remains suspended for commercial shipments, low-value entries must be filed electronically in ACE, and the prepay threshold for postal shipments rose to USD 2,500 on July 24, 2026. CBP’s Entry Type 13 electronic informal mail entry test becomes available on September 22, 2026, inside the holiday inbound window.
The net effect is that a retailer can be receiving refunds on one part of its import book while paying elevated duties on another. Which of the two dominates depends almost entirely on the category mix.
What the low-value import rules mean for holiday inbound
The customs picture matters most in the weeks when replenishment stock and direct-to-consumer parcels cross the border together. With the de minimis exemption suspended, every commercial low-value shipment now needs a filed entry rather than an informal clearance, and the administrative cost of that filing does not scale down with the value of the goods.
For cross-border sellers shipping into the US, the effect is felt as a per-parcel fixed cost rather than a percentage duty. That penalises low-ticket items disproportionately, which is precisely the price band that dominates impulse gifting in November and December.
The Entry Type 13 electronic informal mail entry test, available from September 22, 2026, is aimed at reducing that friction for postal shipments valued at USD 2,500 or less. Because it arrives just before the inbound peak, its practical effect on this season will depend on how quickly filers adopt it rather than on the design of the process itself.
Where AI shopping sits in the 2026 funnel
Bain’s survey puts a number on something retailers have been estimating rather than measuring. Some 24% of respondents plan to begin holiday shopping on an AI platform, up from 17% in the 2025 survey. A further 13% of online shoppers expect to use a retailer’s own AI agent, with Walmart’s Sparky and Amazon’s Alexa for Shopping cited as examples.
Bain’s framing is that AI discovery shapes the top of the customer funnel rather than replacing the checkout. That is a meaningful distinction: it moves the competitive question from conversion to inclusion, since a product that an assistant does not surface never reaches the basket.
The firm’s guidance to retailers reflects this. Its advice is to price key value items competitively for both humans and bots, which acknowledges that a machine comparing prices behaves differently from a shopper comparing shelves. The direction matches what we described in our analysis of why agentic commerce is settling on retailer-controlled checkout before the 2026 holidays.
The practical implications for the next ten weeks are narrow but concrete. Product data completeness, price competitiveness on recognisable items, and availability signals determine whether a catalogue is legible to an assistant at all.
Which consumers are funding the season
The macro backdrop in Bain’s outlook is mixed rather than uniformly positive, and the mix explains where the spending is expected to come from.
On the supportive side, the S&P 500 is up 23% year over year and tax refunds are USD 43 billion higher than a year earlier. Both effects concentrate in upper-income households, where equity holdings and refund balances are largest.
On the constraining side, the unemployment rate sits at 4.1% with labor market participation at a five-year low, and credit card delinquency runs above its ten-year average. Those readings describe pressure at the lower end of the income distribution.
A season financed disproportionately by upper-income households tends to show a specific pattern: resilient premium and gifting categories, sharper trade-down in everyday goods, and heavier reliance on major sale events among value shoppers. Bain reports that 90% of shoppers plan to spend during at least one major retail sale event, which is consistent with an event-concentrated calendar.
| Consumer signal | 2026 reading | Direction for spending |
|---|---|---|
| S&P 500 year over year | Up 23% | Supportive, upper-income skew |
| Tax refunds versus prior year | Up USD 43bn | Supportive |
| Unemployment rate | 4.1% | Neutral |
| Labor force participation | Five-year low | Constraining |
| Credit card delinquency | Above 10-year average | Constraining, lower-income skew |
| Headline inflation versus wages | 3.4% versus 3.1% | Constraining in real terms |
What consumers say they will buy
Category intent in the survey is led by clothing, cited by 43% of respondents as their highest-spending category. Groceries follow at 37% and gift cards at 36%.
Gift cards at 36% deserve attention because of the accounting: the sale registers in the holiday window but the redemption, and the associated margin and attachment, often lands in January or later. A gift-card-heavy season shifts revenue recognition and inventory pull into the following quarter.
Groceries appearing that high in a gifting survey reflects how much of the holiday budget goes on hosting rather than presents. That spend behaves differently from discretionary gifting, since it is closer to non-negotiable and more sensitive to food price movement than to promotional depth.
How the Bain number compares with other forecasters
Bain is early in the forecast calendar. Deloitte and the National Retail Federation typically publish their own outlooks later in September, so the comparison set for the 2026 season is still filling in. Comparing across firms requires care, because the bases differ more than the percentages do.
Deloitte’s forecast for the previous season, issued in September 2025, projected total holiday retail sales of USD 1.61 trillion to USD 1.62 trillion on growth of 2.9% to 3.4%, measured across November through January. Its e-commerce component was USD 305 billion to USD 310.7 billion on growth of 7% to 9%.
| Forecast | Period covered | Base | Headline growth | Online growth |
|---|---|---|---|---|
| Bain, 2026 season | November to December 2026 | Excludes auto dealers, gas stations, restaurants; not seasonally adjusted | 4.5% | 9% |
| Deloitte, 2025 season (issued September 2025) | November 2025 to January 2026 | Broader total including a third month | 2.9% to 3.4% | 7% to 9% |
The two headline totals, above USD 1 trillion and around USD 1.61 trillion, are not in conflict. They cover different month counts and different category bases. The online growth ranges, by contrast, are directly comparable in spirit and sit close together, which strengthens confidence in a high single-digit to 9% e-commerce season.
The gap in headline growth between the two firms is largely a timing artifact, since Deloitte’s number describes the season that has already happened. The useful comparison will arrive when Deloitte and the NRF publish their 2026 outlooks in the coming weeks.
What this means for pricing and promotions
The combination Bain describes, price-driven top-line growth plus refund-funded price cuts plus event-concentrated demand, points to a promotional season that is sharper in places rather than uniformly deeper.
Retailers receiving material IEEPA refunds have a funding source for targeted price investment that competitors without the same import exposure do not have. That is a category-specific advantage rather than a market-wide one, and it will show up unevenly across the SERP and the shelf.
Categories still carrying Section 232 duties face the opposite arithmetic. Furniture, home goods with wood content, and metals-intensive products carry cost that no refund offsets, and discount depth there has to come out of margin.
The event concentration compounds this. With 90% of shoppers planning to spend during at least one major sale event, demand clusters into a small number of dated windows, and pricing decisions inside those windows carry disproportionate weight on the full-season margin.
That argues for depth over duration. A shorter, sharper event on a defined set of items generally protects margin better than a long promotional runway, particularly when the underlying volume growth is only a couple of percent.
Electronics illustrate how component costs can override the general promotional trend, and our earlier work on why holiday electronics discounts are likely to shrink in 2026 shows how an input cost shock narrows the discount band regardless of how competitive the category looks.
Where the margin actually comes from
In a season where price carries the top line and promotional funding is uneven, incremental margin increasingly comes from sources that sit outside the shelf price. Retail media is the clearest example, since it monetises traffic the retailer already has.
That dynamic is the subject of our analysis of why retail media is likely to fund holiday 2026 margin rather than the shelf price, and it fits Bain’s picture: a large nominal season with tempered bottom lines is exactly the setting in which non-merchandise income does the profit work.
The risk in that model is circular. If media spend is funded by suppliers who then need price support to move the units, the margin gain can be partly recycled back into promotion. The retailers that come out ahead are the ones that keep the two budgets genuinely separate.
What could break the forecast, and what to watch
The four assumptions doing the work
Bain’s outlook rests on a small number of assumptions that are all observable between now and December, which makes it unusually easy to stress-test in real time.
The first is the inflation path. The forecast depends on headline inflation staying near 3.4% and core near 2.5%. An energy move in either direction changes the nominal total without changing a single unit of demand.
The second is the refund flow. If CAPE disbursement slows, the price investment that several retailers have signalled becomes harder to fund, and promotional plans built around it get pulled back late in the calendar.
The third is the labor market. With participation at a five-year low and delinquency above its ten-year average, a deterioration in employment during October or November would hit exactly the households that rely most on sale events.
The fourth is the September 29 Section 232 pharmaceutical effective date for non-Annex III manufacturers, which lands before the season begins and adds cost to a category that retail pharmacy and mass merchants carry.
The markers to check before Black Friday
The forecast becomes checkable well before the season closes, and a handful of markers will confirm or contradict it early.
Watch the Deloitte and NRF 2026 forecasts due later this month, and specifically whether their online growth ranges cluster around Bain’s 9%. Convergence across three independently constructed models would make the channel split the most reliable part of the outlook.
Watch October retail sales for the split between price and volume, since the real-growth residual is where the season is genuinely decided. Watch how many retailers explicitly attribute price cuts to tariff refunds in their November guidance, which will indicate whether the refund pass-through is broad or confined to a few importers.
Finally, watch whether the 24% AI discovery figure translates into measurable referred traffic rather than stated intent. Survey intent has historically overstated adoption of new shopping channels in their first commercial season, and the 2026 holidays are the first proper test at scale.
Frequently asked questions
How much will US holiday retail sales be in 2026?
Bain & Company forecasts more than USD 1 trillion in US retail sales across November and December 2026, up 4.5% year over year. The figure excludes sales by auto and auto parts dealers, gas stations, and restaurants, and it is not seasonally adjusted.
Is the $1 trillion holiday forecast adjusted for inflation?
No. It is a nominal figure measured in current dollars. Bain states that more than 50% of the nominal growth comes from higher inflation, which implies real volume growth closer to the low single digits.
How fast is online holiday shopping growing in 2026?
Bain forecasts 9% growth in nonstore sales, which covers e-commerce and mail order, against 2.5% growth in stores. Nonstore is expected to supply 60% of total seasonal growth, up from about 50% a year earlier, while in-store still accounts for close to 70% of the total.
Will tariffs make holiday prices higher in 2026?
It depends on the category. IEEPA tariffs were struck down by the Supreme Court in February 2026 and refunds are being processed, which several retailers plan to pass through as lower prices. Section 232 duties on steel, aluminum, copper, wood products and patented pharmaceuticals remain in force and continue to add cost.
How do tariff refunds reach retailers?
US Customs and Border Protection processes them electronically through the CAPE mechanism inside ACE. Phase 1 opened on April 20, 2026 and Phase 2 on June 29, 2026. Importers need electronic payment details on file, and disbursement is staged over time rather than paid in one settlement.
What are consumers planning to buy most this holiday season?
In Bain’s survey of 1,105 US consumers, clothing led as the highest-spending category at 43%, followed by groceries at 37% and gift cards at 36%. Respondents could select multiple answers.
How many shoppers will use AI to shop this holiday?
Bain found that 24% of respondents plan to start their holiday shopping on an AI platform, up from 17% in 2025. A further 13% of online shoppers expect to use retailer-operated AI agents such as Walmart’s Sparky or Amazon’s Alexa for Shopping.
How does the Bain forecast compare with Deloitte and the NRF?
Deloitte and the NRF typically publish later in September, so the 2026 comparison set is incomplete. Deloitte’s forecast for the previous season projected USD 1.61 trillion to USD 1.62 trillion across November to January on 2.9% to 3.4% growth, with e-commerce up 7% to 9%. The totals differ mainly because the periods and category bases differ.
What would cause the forecast to miss?
The main risks are an inflation move that changes the nominal total without changing demand, a slowdown in tariff refund disbursement that removes the funding behind planned price cuts, and a deterioration in employment during October or November affecting households that depend on major sale events.