
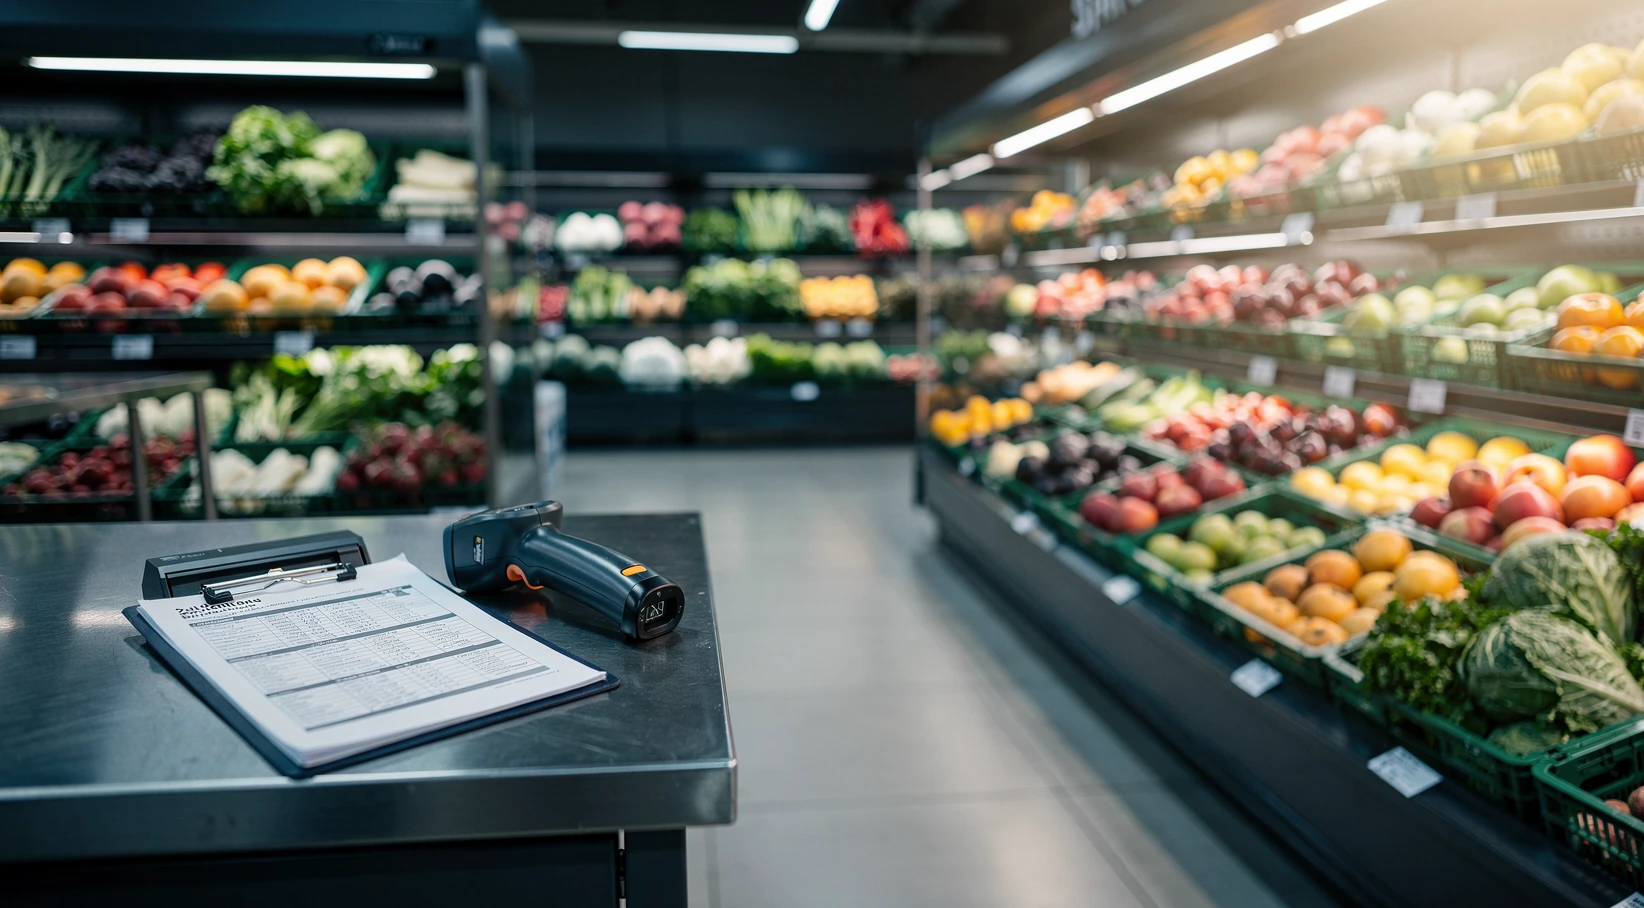
Ask a grocery chain where its margin goes and the answer usually arrives as a single number: total shrink as a percentage of sales. That number is almost useless to the person who has to fix it. Shrink in a center-store aisle of canned soup and shrink in a produce cooler are different problems with different causes, different clocks and different fixes.
Fresh departments (produce, meat, seafood, deli, bakery and prepared foods) carry the majority of a typical grocer’s shrink dollars while occupying a minority of the store’s square footage. The reason is structural rather than managerial. Fresh product has a shelf life measured in days, a yield loss built into every cut and trim, and a customer who rejects anything that looks tired.
This guide covers how grocers separate fresh shrink into buckets they can actually act on, how to measure it at department level, and where the recoverable dollars sit. Much of it connects back to broader floor discipline, which is covered in the retail store operations playbook.
In short
- Fresh is where the money leaks. Produce, meat, deli and bakery typically account for the bulk of a grocer’s shrink dollars even though they are a fraction of total SKUs.
- Theft is the smaller half of fresh shrink. Spoilage, trim and yield loss, prep waste and unsold markdowns usually outweigh external theft in perishable departments.
- One store-level shrink number hides everything. Measuring by department, and ideally by category inside the department, is what turns shrink from a complaint into a work list.
- Markdowns have a window. A markdown taken on the last day of shelf life mostly funds a discount on product that would have sold anyway or fails to sell at all.
- Ordering discipline beats disposal cleverness. Donation and secondary markets recover cents on the dollar; ordering to a shelf-life plan protects the whole dollar.
What counts as shrink in fresh and how it differs from theft
Shrink, in the accounting sense, is the gap between the inventory a store should hold on paper and the inventory it actually holds when someone counts it. That definition is deliberately agnostic about cause. It captures theft, spoilage, damage, miscounts, receiving errors, scan errors at the register and product given away or thrown out.
In dry grocery, that gap skews heavily toward theft and paperwork error, because a can of beans does not decay on the shelf inside a fiscal quarter. In fresh, the same gap is dominated by product that expired, was trimmed away, was prepped into something that never sold, or was thrown out because it stopped looking sellable. The word is the same and the root cause is not.
The practical consequence is that anti-theft investment does very little for a produce manager. Cameras, gates and staffed exits address a category of loss that, in most fresh departments, is not the dominant one. The broader trade-off between security spend and shopper experience is covered separately in our piece on theft, shrink and loss prevention.
The four buckets fresh shrink actually falls into
Most grocers that get traction on fresh shrink start by forcing every loss into one of four buckets. The buckets matter because each one has a different owner and a different fix.
- Expiry and spoilage. Product that reached its sell-by date, or visibly degraded before it, and was disposed of. This is an ordering and rotation problem first.
- Yield and trim loss. The weight lost between the case that arrives and the package that sells: butcher trim, produce culling, outer leaves, bakery scrap. This is a specification and technique problem.
- Prep and production overrun. Rotisserie chickens, deli salads, cut fruit and in-store bakery items produced in quantities the day never absorbed. This is a production-planning problem.
- Unrecovered markdowns. Product marked down that still failed to sell, so the store ate both the discount and the disposal. This is a timing problem.
External theft exists in fresh (meat is a common target, and so are high-value items like seafood and specialty cheese) but it rarely explains a department-wide trend. When a fresh shrink number moves several tenths of a point in a quarter, the cause is usually in one of the four buckets above.
Why theft numbers mislead a fresh manager
Industry surveys tend to report shrink as a single blended rate. The National Retail Federation’s National Retail Security Survey, for example, has reported total retail shrink in the low-to-mid 1% range of sales in recent years, and readers should check the current edition directly with the NRF rather than relying on a figure quoted secondhand. That blended figure covers all retail formats and all departments.
Applying a blended benchmark to a fresh department produces false comfort or false alarm. A produce department running at a rate several times the store average may be performing normally for its category mix, while a dry grocery aisle at the same rate would signal a serious problem. Benchmarks are only useful when they are department-specific and, ideally, drawn from comparable stores in the same chain.
Measuring shrink by department instead of one store number
The single most common measurement failure in grocery is reporting shrink at store level and nothing below it. A store number tells an operator that something is wrong. It never tells them where, and it averages a well-run bakery together with a produce cooler that is bleeding.
Department-level measurement is the minimum useful resolution. Category-level measurement inside the department (bananas separate from berries, ground beef separate from case-ready steak) is where the actual work list appears. Most modern grocery inventory systems can produce this; the constraint is usually that nobody has configured the reporting hierarchy to match how the department is actually run.
The denominator problem
Shrink as a percentage of sales and shrink as a percentage of purchases are different metrics and they move in different directions. A department with declining sales can show a rising shrink percentage while its absolute waste in dollars is flat or falling. That artifact has sent more than one grocery team chasing a problem that was really a demand story.
The cleanest practice is to track three figures together for each department: shrink dollars, shrink as a percentage of department sales, and shrink units where units are meaningful. Dollars tell you the size of the prize. The percentage tells you whether performance is drifting. Units keep the conversation concrete for the people on the floor.
A weekly measurement cadence that survives a busy store
Fresh shrink data has to be captured at the point of disposal, which means someone scans or logs product before it goes in the bin. Anything that relies on reconstructing losses later, from a count variance at month end, will be too late and too vague to act on.
The realistic cadence for most mid-size grocers is daily capture and weekly review. Daily capture keeps the data honest because the person logging it still remembers the case. Weekly review is frequent enough to catch a bad ordering pattern before it compounds across a full order cycle, which fits the rhythm described in our guide to store KPIs worth tracking weekly.
What a useful fresh shrink report contains
A report that changes behavior looks different from one that satisfies an auditor. It should name the top ten items by shrink dollars in the department, show the trend against the prior four weeks, and split each item’s loss between the four buckets described above.
Reports that stop at a department total get read once and filed. Reports that say “bagged salad lost $412 last week, 78% of it to expiry, up from $190 four weeks ago” produce an ordering change on the next cycle.
| Department | Dominant loss bucket | Typical clock | Measurement that matters most |
|---|---|---|---|
| Produce | Expiry and culling | 2–7 days for most items | Shrink dollars by item, cull weight at receiving |
| Meat | Yield and trim loss, then expiry | 3–5 days in case | Yield percentage by cut, markdown sell-through |
| Seafood | Expiry and quality rejection | 1–3 days | Daily disposal units, case presentation audits |
| Deli and prepared | Production overrun | Same day to 3 days | Production versus sales by daypart |
| In-store bakery | Production overrun and staling | 1–2 days | Bake plan accuracy, end-of-day remainder count |
| Dairy and eggs | Rotation failure and damage | 7–21 days | Date-code audits, breakage log |
Ordering to a shelf-life plan rather than to a shelf gap
The default ordering instinct in fresh is visual. A department manager walks the floor, sees a gap in the display, and orders to fill it. That instinct produces full-looking displays and a predictable volume of waste, because it optimizes for presentation on the day the order lands rather than for sell-through across the item’s remaining life.
Ordering to a shelf-life plan inverts the question. Instead of asking how much product fills the case, it asks how much product this item can realistically sell before it stops being sellable. For a berry with a four-day usable life and an average of 30 units sold per day, the answer bounds the order regardless of how empty the display looks.
Case-pack math is where fresh ordering breaks
Suppliers ship in case packs, and case packs rarely divide neatly into a store’s demand. An item that sells 18 units a day with a three-day life, shipped in cases of 24, forces a choice between chronic gaps and chronic overstock. Many fresh shrink problems are really case-pack mismatches that nobody escalated to the buying team.
The fix is a purchasing conversation rather than a store one. Smaller case packs, split cases or a shorter delivery interval each solve it, and each has a cost that has to be weighed against the shrink it prevents. Documenting the mismatch item by item is what turns it from a floor complaint into a negotiable line with a vendor.
Forecast inputs that actually move fresh accuracy
Fresh demand responds to a small set of variables with unusual force. Weather is the most underrated: a temperature swing moves grilling meat, salad and ice cream materially within a single day. Local events, school calendars, paydays and the timing of major holidays all shift fresh volume in ways that a naive four-week average will miss.
Promotional lift is the other major input and the one most often mishandled. An item on ad needs an order built on its promoted velocity, and the week after the promotion needs an order built on the fact that many households just bought a two-week supply. Failing to step the order back down after a promotion is a reliable way to generate a wave of expiry a week later.
Who owns the order matters more than the tool
Automated replenishment systems do well on stable center-store items and struggle on short-life fresh items with volatile demand. Most chains land on a hybrid: system-suggested orders that a department manager can override, with the override logged.
Logging overrides is the part that gets skipped and the part that pays. When shrink spikes on an item, the first question is whether the system suggested the quantity or a person did. Without that record, the review turns into a conversation about impressions.
Markdown timing: the window where a markdown still sells
A markdown is a partial recovery. Taken at the right moment, it converts product that was heading for the bin into cash at a reduced margin. Taken too late, it converts product that was heading for the bin into product that still heads for the bin, minus a discount that a few price-sensitive shoppers happily took.
The window is narrower than most stores assume. For an item with a seven-day life, a markdown on day six is often too late, because the remaining shoppers who would buy it at any price have already passed through and the product now looks like what it is.
Why a single end-of-day markdown loses money
The traditional approach is one markdown pass late in the day, usually because that is when staff have time. It is convenient and it is expensive. The evening shopper base is smaller than the afternoon base in most formats, and the product has already lost a day of presentation quality.
A staged approach moves more units. A modest discount taken earlier, with a deeper cut later only for what remains, captures shoppers at two different price points instead of gambling everything on the last hour. The trade-off is labor: staged markdowns cost more handling time, which has to be planned into the schedule rather than squeezed in, a constraint covered in our guide to building a store labor schedule.
Cannibalization is real but usually overstated
The standard objection to earlier markdowns is that they train shoppers to wait and cannibalize full-price sales. That effect exists, particularly in bakery where a predictable evening discount creates a predictable evening customer.
In practice it is bounded by the fact that marked-down fresh product is visibly older and inconsistently available. The larger risk in most departments is the opposite: markdowns taken so late and so predictably that they recover almost nothing.
| Approach | When the cut happens | Typical recovery | Labor cost | Main risk |
|---|---|---|---|---|
| Single end-of-day pass | Final 1–2 hours of trading | Lowest, much goes unsold | Low | Product already unsellable, trains evening bargain traffic |
| Staged two-step markdown | Mid-afternoon, then evening | Highest of the three | Highest | Requires disciplined date auditing and scheduled labor |
| Fixed day-before-expiry rule | 24 hours before sell-by | Moderate and predictable | Moderate | Ignores item-level velocity differences |
| Dynamic date-triggered pricing | System-driven by remaining life | High where implemented well | Low after setup | Setup cost, depends on accurate date capture |
Prep, rotation and the handling losses nobody logs
A meaningful share of fresh shrink never appears in a disposal log because it never becomes a discrete unit. Trim that goes into a barrel during cutting, produce culled at receiving, bakery dough scrap and the fruit that gets bruised in handling all leave the building as weight rather than as items.
These losses are real margin and they are the hardest category to see. A department can run a clean disposal log and still lose several points of margin upstream of the case, invisible to a report built only on scanned waste.
Yield loss in cutting and prep
Every cut has an expected yield. A primal breaking down into retail cuts, a case of romaine becoming bagged hearts, a wheel of cheese becoming wedges: each has a specification, and the gap between specification and actual is a measurable loss.
Chains that manage this well audit yield periodically rather than continuously. Weighing input and output on a sample basis, a few times per quarter per cutter, catches technique drift without turning the department into a laboratory. The result is often a training conversation rather than a systems change.
Rotation discipline and the FIFO gap
First-in-first-out is universally taught and inconsistently practiced, usually because stocking under time pressure is faster when new product goes on top. The cost surfaces days later as a cluster of expired product at the back of a case.
Date-code audits are the standard check: a manager pulls a sample of facings and verifies that the front-facing product carries the earliest date. Recording the audit result, rather than just correcting the shelf, is what makes the problem visible enough to fix.
Temperature and handling
Cold chain integrity affects shelf life directly, and small deviations compound. The US Food and Drug Administration’s Food Code sets cold holding requirements for potentially hazardous foods, and the current edition should be consulted at the FDA’s Food Code page for the applicable figures, since state and local jurisdictions adopt different versions.
Beyond the compliance floor, the operational point is that product spending time on a dock, in a warm backroom or in an overloaded case loses usable days. Those days do not show up as a violation. They show up as shrink two days later, attributed to expiry, with nobody connecting it to the handling that caused it.
Donation, secondary markets and waste routes that recover value
Once product cannot be sold at full price or at markdown, the question shifts from recovering revenue to recovering value and reducing disposal cost. The options form a rough hierarchy, and most grocers use several simultaneously.
Food donation to hunger relief organizations is the highest-value route for product that is still safe and wholesome but no longer sellable, such as items past a sell-by date that remain within a safe window, or cosmetically imperfect produce. Donation programs also carry a documentation burden and require an established relationship with a recipient organization that can handle refrigerated pickup.
The liability question grocers ask first
The most common objection to donation is liability. In the United States, the Bill Emerson Good Samaritan Food Donation Act provides liability protection for good-faith donations of apparently wholesome food to nonprofit organizations, and the Food Donation Improvement Act enacted in 2023 expanded aspects of that protection. Both are federal statutes, and the operative text should be read at its official source rather than summarized from a vendor deck.
What that protection covers, what conditions attach to it and how it interacts with state law are questions with real answers that depend on the specific program a store runs. Grocers setting up or changing a donation program generally work through counsel and through the recipient organization’s own compliance process rather than relying on a general description.
Routes below donation
Animal feed, rendering and industrial uses take product that is no longer fit for human consumption but still has value as an input. Composting and anaerobic digestion sit below that, recovering nutrients or energy while avoiding landfill tipping fees, which in some markets are the larger financial driver.
The US Environmental Protection Agency publishes a wasted food hierarchy that ranks these routes, and the US Department of Agriculture’s Economic Research Service has published estimates of food loss at the retail and consumer levels; the ERS figures are available through the USDA Economic Research Service and should be read in their current published form, since methodology and estimates have been revised over time.
Secondary markets and discount channels
Some chains route short-dated product to discount banners, employee sales or partnerships with surplus food apps. Each recovers more than composting and less than a timely markdown, and each carries brand considerations that vary by market.
The financial case is usually straightforward and the operational case is where these programs fail. A surplus channel that requires staff to pack and stage product during the busiest hour of the day tends to quietly stop happening within a few months.
A note on scope
This article is general information about grocery operations and is not legal, tax or food-safety compliance advice. Donation liability protections, date-labeling rules, food safety requirements and waste disposal regulations vary by jurisdiction and change over time. Any grocer designing a donation program, changing date-labeling practice or handling a food safety question should consult a qualified attorney, a food safety professional and the applicable federal, state and local regulators for their specific situation, and should verify all figures and legal requirements at the official source.
Targets a mid-size grocer can realistically hit
Setting a fresh shrink target is where many programs lose credibility. A target set at zero, or at a number pulled from a chain with a different format and different volumes, gets dismissed by the department managers who have to hit it.
Useful targets are set per department, indexed to comparable stores in the same chain, and expressed as an improvement against the store’s own trailing performance rather than as an absolute. A produce department moving from its own trailing twelve-week average toward the best quartile of comparable stores is a target a manager can believe.
Sequencing the work
The order of operations matters more than the ambition. Measurement comes first, because a department that cannot see item-level loss cannot prioritize. Ordering discipline comes second, because it protects the whole margin rather than a fraction of it. Markdown timing comes third, and disposal routing last.
Reversing that order is the common failure. Stores that start with a composting contract and a donation partner before fixing ordering end up with a well-run waste operation processing a volume that should never have been ordered.
What a realistic first year looks like
Most chains that take fresh shrink seriously see the largest single improvement in the first two quarters, driven almost entirely by measurement and ordering changes rather than by anything sophisticated. The gains after that are smaller, harder and more dependent on execution consistency.
Sustaining the improvement is the harder problem. Shrink discipline decays when a strong department manager leaves, which is why the process needs to live in documented routines rather than in one person’s habits, the same principle that runs through the retail store operations playbook and through the operational readiness checks in our guide to opening a second store.
| Phase | Focus | Typical duration | What good looks like |
|---|---|---|---|
| Phase 1 | Item-level disposal capture in every fresh department | 4–8 weeks | Daily scanned waste, weekly top-ten report by department |
| Phase 2 | Ordering against shelf life, case-pack review | 8–16 weeks | Overrides logged, case-pack mismatches escalated to buying |
| Phase 3 | Staged markdown timing with scheduled labor | 6–12 weeks | Markdown sell-through tracked, not just markdown dollars |
| Phase 4 | Prep yield audits and rotation discipline | Ongoing quarterly | Sampled yield checks, recorded date-code audits |
| Phase 5 | Donation and waste routing for the residual | Ongoing | Reliable pickup, documented process, disposal cost tracked |
FAQ on grocery shrink
What is a normal shrink rate for a grocery store?
There is no single normal rate, and blended industry figures are a poor benchmark for any individual department. The National Retail Federation’s National Retail Security Survey publishes an all-retail shrink figure that has sat in the low-to-mid 1% of sales range in recent editions, but fresh departments typically run well above a store’s blended number while dry grocery runs below it. The most useful comparison is against similar-format stores in the same chain, and the current NRF figure should be verified with the NRF directly.
How much of grocery shrink is theft versus spoilage?
It depends entirely on the department. In fresh departments, spoilage, trim and yield loss, prep overrun and unsold markdowns generally outweigh external theft. In center store and in high-value non-food categories, theft is a much larger share. Reporting a single store-wide theft-versus-spoilage split usually obscures more than it explains.
Why does fresh shrink stay high even when a store orders less?
Cutting order volume without changing order timing tends to produce gaps rather than lower waste. If a store still orders a full case of a three-day item because that is the only pack size available, reducing frequency simply concentrates the same waste into fewer, larger events. The fix usually involves case-pack size or delivery frequency rather than order quantity alone.
When is the right time to mark down fresh product?
Early enough that the product still looks worth buying and shopper traffic is still strong. For most short-life items this means a first markdown well before the final day rather than a single pass in the last hour of trading. A staged approach, with a modest cut earlier and a deeper cut later, typically recovers more than one deep late cut.
Does marking down early train customers to wait for discounts?
Some cannibalization occurs, and it is most visible in bakery where a predictable evening discount attracts a predictable customer. It is bounded by the fact that marked-down fresh product is visibly older and inconsistently available. In most departments the larger financial risk is marking down too late and recovering almost nothing.
How should a grocer measure shrink in a fresh department?
Capture losses at the point of disposal by scanning or logging product before it goes in the bin, then report at item level within each department. Track shrink dollars, shrink as a percentage of department sales, and units together, because the percentage alone can move purely on a change in sales. Weekly review with a top-ten items list is enough cadence for most mid-size operators.
Can donated food create legal liability for a grocer?
In the United States, the Bill Emerson Good Samaritan Food Donation Act provides liability protection for good-faith donations of apparently wholesome food to nonprofit organizations, and the Food Donation Improvement Act enacted in 2023 expanded aspects of it. The scope of that protection and its interaction with state law depend on the specific program, so grocers generally work through legal counsel and the recipient organization’s compliance process. This is general information rather than legal advice.
What is yield loss and why does it not show up in waste logs?
Yield loss is the weight lost between the case that arrives and the packaged product that sells: butcher trim, produce culling, outer leaves and bakery scrap. It leaves the building as bulk weight rather than as scanned units, so a disposal log built on scanning misses it entirely. Periodic sampled yield audits, weighing input against output for a given cut, are the standard way to surface it.
Which fresh department should a grocer fix first?
Sort by shrink dollars rather than by shrink percentage, because the percentage flatters small departments and punishes large ones. In most mid-size grocers that ranking puts produce or meat at the top. Starting with the department holding the most dollars also gives the program a visible early result, which matters for keeping department managers engaged.