
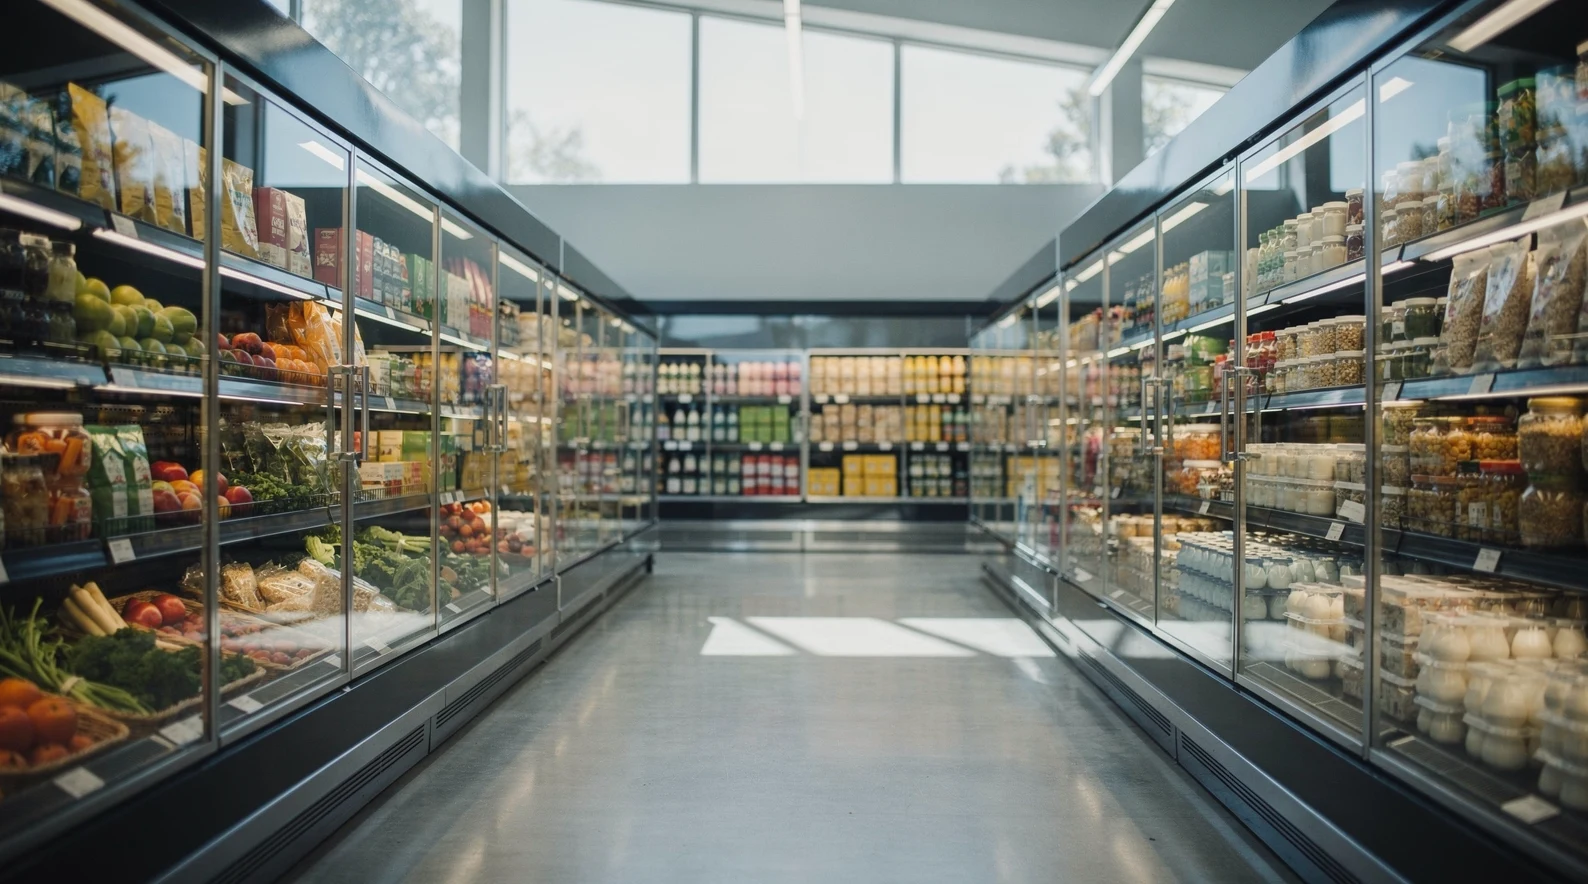
Grocery retailers in the United States are absorbing two shocks at once, and both land on the same balance sheet. The number of people receiving Supplemental Nutrition Assistance Program benefits has fallen by almost 13% in a year, according to federal participation data analyzed by Grocery Dive on August 17. At the same time, every SNAP-authorized store in the country has until November 4, 2026 to meet a materially tougher stocking standard set by the US Department of Agriculture.
The combination is unusual. Demand from a customer segment worth roughly $100bn a year in federal spending is contracting, while the cost of staying authorized to serve that segment is rising. For the more than 267,000 stores authorized to accept SNAP benefits, the question is no longer whether the program is changing but how much shelf space and capital the change will consume.
The stocking rule was published in the Federal Register on May 8, 2026 and took legal effect on July 7. Retailers were given a compliance runway that expires on November 4. Trade groups estimate the upfront cost across formats runs well past $1.5bn, with convenience stores carrying the heaviest per-store burden.
In short
- SNAP enrollment fell nearly 13% year over year to just over 37 million people in April 2026, with 49 of 50 states posting declines.
- A USDA final rule raises the staple food stocking minimum from three to seven distinct varieties in each of four categories, with a compliance deadline of November 4, 2026.
- Upfront compliance costs are estimated at about $1bn for convenience stores, $305m for grocers and $215m for supercenters, according to a NACS and FMI survey.
- The enrollment contraction traces to the 2025 budget law, which tightened work requirements, raised the age threshold to 65 and removed several exemptions.
- Arizona lost more than half its SNAP caseload, the steepest decline in the country, while Alaska was the only state to grow.
What the November 4 SNAP stocking deadline actually requires
The final rule is titled “Updated Staple Food Stocking Standards for Retailers in the Supplemental Nutrition Assistance Program.” It rewrites the test that determines whether a store qualifies to accept SNAP benefits at all. USDA framed the change as an effort to ensure that authorized retailers carry what the agency described as more real food.
The core change is arithmetic. Where a store previously had to stock three distinct varieties in each staple food category, it must now stock seven. That is a 133% increase in the breadth requirement, applied simultaneously across four categories.
The perishability requirement tightened as well. Previously a store had to offer at least one perishable variety in two of the four categories. Under the new standard, that obligation extends to three of the four.
The four staple food categories
USDA defines staple foods across four buckets: dairy, fruits or vegetables, grains (including bread and cereal), and protein (meat, poultry or fish). Each bucket now carries the same seven-variety floor. A store failing any single category fails the test.
That last point matters more than the headline number. A convenience store that already carries a deep beverage and snack assortment gets no credit for it, because accessory foods do not count toward staple categories. The binding constraint is usually dairy or fresh produce, the two categories where small-format stores have the least cold-chain capacity.
What counts as a distinct variety
The rule codifies a framework for determining what qualifies as a distinct variety rather than a duplicate. Two package sizes of the same product do not count twice. Neither, in general, does the same food in a different brand.
This is where compliance projects tend to run over budget. Retailers who assumed they were close to the seven-variety threshold often discover on audit that half their apparent breadth collapses into a handful of genuinely distinct items. Rebuilding the assortment then requires new supplier relationships, not just a bigger order from an existing one.
Who is exempt
Specialty stores sit outside the seven-variety requirement. USDA guidance points to butchers and farm stands as the archetypes, on the logic that a business built around one staple category should not be penalized for lacking the other three.
For everyone else, the standard applies uniformly. A 2,000 square foot corner store and a 180,000 square foot supercenter face the same categorical floor, which is precisely why the per-store cost burden falls so unevenly.
How the old and new standards compare
The practical distance between the two standards is easier to read side by side. The category structure did not change, but every threshold inside it did.
| Requirement | Previous standard | Standard from November 4, 2026 | Change |
|---|---|---|---|
| Distinct varieties per staple category | 3 | 7 | Up 133% |
| Staple food categories covered | 4 | 4 | Unchanged |
| Categories requiring a perishable variety | 2 of 4 | 3 of 4 | Up 50% |
| Total distinct staple items implied | 12 | 28 | Up 16 items |
| Specialty store exemption | Available | Available | Unchanged |
| Accessory foods counted toward staples | No | No | Unchanged |
Twenty-eight distinct staple items is the number that reframes the exercise. For a supermarket that is trivially satisfied within a single aisle. For a forecourt convenience store it can represent a substantial share of the entire ambient and chilled assortment.
The perishable expansion carries more weight than the variety count for small formats. Adding a seventh shelf-stable grain is a purchasing decision, while adding a perishable dairy or produce line is a refrigeration decision with a capital cost attached.
Why SNAP enrollment fell 13% in a year
The participation decline is not a data artifact. National SNAP enrollment stood at just over 37 million people in April 2026, down nearly 13% from April 2025. Grocery Dive reported that 49 of 50 states recorded year-over-year declines.
The trend has been running longer than a single year. Enrollment fell from roughly 42 million in June 2025 to about 38 million by February 2026, a decline of roughly 10% in eight months. April 2026 extended that trajectory rather than breaking it.
The proximate cause is legislative. The budget reconciliation package signed in summer 2025, commonly referred to as the One Big Beautiful Bill Act, rewrote SNAP eligibility in several directions at once.
The work requirement rules that changed
The law raised the upper age limit for work requirements to 65. It also removed exemptions that had previously covered veterans, people experiencing homelessness and young adults who had aged out of foster care.
Each of those changes moves a defined population from automatically eligible to conditionally eligible. Conditional eligibility, in practice, means a share of that population falls off the rolls regardless of whether they meet the underlying condition.
The paperwork burden
The second mechanism is administrative rather than substantive. The tightened rules require monthly documentation of work activity, replacing less frequent recertification for many recipients.
Monthly reporting produces attrition independent of eligibility. The Congressional Budget Office has projected that the changes will reduce participation by roughly 2.4 million people per month over the next decade. That figure represents people who would otherwise qualify, not people found ineligible.
For grocers, the distinction is academic. A household that loses benefits because it missed a filing deadline stops spending the same money as a household that loses benefits on the merits. Both show up as a hole in weekly comparable sales, a dynamic our analysis of Kroger and Walmart grocery positioning traced through the low-income basket.
Which states lost the most SNAP participants
The decline is national but the distribution is not. State administrative choices, waiver status and error rates produced a spread of more than 58 percentage points between the steepest decline and the only increase.
| State or territory | Change in SNAP participation, April 2025 to April 2026 | Direction |
|---|---|---|
| Arizona | More than 50% decline | Steepest fall |
| Georgia | About 28% decline | Sharp fall |
| Florida | More than 20% decline | Sharp fall |
| Louisiana | More than 20% decline | Sharp fall |
| California | About 6.6% decline | Shallow fall |
| New Mexico | About 4% decline | Shallowest fall |
| Alaska | About 8.1% increase | Only state to grow |
| Guam | About 6.9% increase, to 39,546 people | Territory growth |
| National | Nearly 13% decline, to just over 37 million | 49 of 50 states down |
Arizona’s contraction is the outlier that shapes the national average. A caseload halving in twelve months implies an administrative reset rather than an economic one, since no state labor market moved that far in that window.
The concentration of steep declines in Georgia, Florida and Louisiana matters commercially. Those are markets where dollar stores and regional supermarket chains hold meaningful share, and where SNAP redemptions represent an above-average slice of grocery revenue.
What the compliance bill looks like by store format
Cost estimates for the stocking rule come from a survey conducted by NACS and FMI, the Food Industry Association, rather than from USDA’s own regulatory analysis. The trade group figures are therefore advocacy-adjacent and should be read as an upper-bound industry estimate.
| Format | Estimated upfront cost | Estimated annual ongoing cost | Per-store implication |
|---|---|---|---|
| Convenience stores | Up to $1bn | About $379m | About $6,700 per store across 150,000+ locations |
| Grocers | About $305m | Not separately estimated | Lower per-store cost, existing cold chain |
| Supercenters | About $215m | Not separately estimated | Mostly systems and labeling, not assortment |
| All formats | About $1.52bn combined | Ongoing labor is the primary driver | Roughly 120 hours per store for system updates |
The per-store figures explain the political shape of the debate. A supercenter absorbing a share of $215m across a few thousand locations faces a rounding error. A single-site convenience operator facing $6,700 and 120 hours of labor faces a decision about whether SNAP authorization is worth keeping.
That asymmetry has a predictable consequence. If a meaningful number of small-format stores drop authorization rather than comply, benefit redemption concentrates further into the large formats that already capture the majority of the spend.
Where the labor cost actually sits
The NACS and FMI survey identifies labor, not inventory, as the dominant ongoing expense. The roughly 120 hours per store covers point-of-sale reconfiguration, item-level eligibility flagging and staff training on what now qualifies.
Inventory is a one-time working capital hit. Systems and training are recurring, because assortment changes and staff turnover both force revalidation. That is why the annual ongoing figure for convenience stores, at about $379m, runs close to 38% of the upfront number.
How the seven-variety test changes supplier negotiations
Compliance is usually described as a retailer problem, but the mechanics push a substantial share of the work onto suppliers and distributors. A store that needs four additional distinct dairy varieties cannot conjure them from its existing purchase order.
The constraint is order minimums. Wholesale distributors build their economics around case quantities and delivery frequency, neither of which flexes easily for a single small-format customer adding a handful of slow-moving items.
Why distributor minimums become the bottleneck
A convenience store adding perishable dairy typically faces a case-pack minimum well above what the site will sell before expiry. The resulting shrink is a recurring cost that does not appear in the upfront compliance estimate.
That gap explains why the trade group survey separates upfront and ongoing costs so sharply. The roughly $379m annual figure for convenience stores captures labor and systems, but persistent shrink on compliance-driven perishables is an additional operating drag that individual operators absorb quietly.
Larger operators solve this with distribution center consolidation and cross-docking. Independents without that infrastructure depend on direct store delivery vendors, whose route economics determine whether a compliant assortment is even orderable at the required cadence.
Where direct store delivery vendors gain leverage
Direct store delivery suppliers in dairy, bread and fresh produce are the natural beneficiaries of a rule that mandates breadth in exactly those categories. They already service small formats at high frequency, which is the capability the rule effectively requires.
That leverage tends to show up in terms rather than headline price. Vendors servicing compliance-critical categories can hold firmer on shelf placement, promotional participation and payment terms, because the retailer’s alternative is losing SNAP authorization entirely.
The private label question
Private label complicates the distinct-variety calculation in a useful direction for larger grocers. A retailer with an established own-brand program can build breadth across categories without adding new supplier relationships, because the manufacturing base is already contracted.
This is a structural advantage that compounds. Chains with deep private label penetration meet the seven-variety floor at lower marginal cost than chains dependent on national brands, and they capture better margin on the incremental items they add.
How grocery demand shifts when SNAP rolls shrink
SNAP spending does not distribute evenly across retail. More than 80% of benefits are redeemed at superstores and supermarkets, even though convenience and grocery stores make up the majority of authorized locations by count.
Retailer-level exposure follows shopper behavior. Roughly 94% of SNAP shoppers spend at least some of their benefits at Walmart, according to industry survey data. Amazon captures a little more than 52% of SNAP shoppers and Kroger around 49%.
Those overlap figures mean a 13% enrollment decline does not translate into a 13% sales decline anywhere in particular. It translates into a broad, shallow drag concentrated in the value tier, where trip frequency and basket size both compress.
Why the effect shows up in units before dollars
Benefit-funded baskets skew toward staples with low price elasticity and high unit counts. When benefits contract, households cut units and trade toward private label rather than abandoning the category.
The result is a margin-mix effect that can mask the volume loss. A grocer can hold dollar comps roughly flat while losing real volume, which is one reason private label share gains in grocery have accelerated alongside the benefit reductions.
Trip frequency falls faster than basket size
Benefit-funded households tend to shop on a benefit-issuance cycle rather than a weekly one. When monthly benefit amounts fall or lapse entirely, the first behavioral casualty is the fill-in trip rather than the stock-up trip.
That pattern concentrates the damage in formats built on trip frequency. Convenience stores, dollar stores and small-format urban grocery lose disproportionately, while the once-monthly supercenter run proves more durable.
Value-tier retailers have responded by leaning harder into opening price points and multi-buy mechanics. The strategy protects unit volume at the cost of mix, which is visible in the widening gap between reported comparable sales and reported gross margin across the discount segment.
What this means for convenience stores
Convenience stores face the sharpest version of the problem. They carry the highest per-store compliance cost, the least cold-chain capacity to satisfy the perishable requirement, and the smallest share of redemption dollars to justify the investment.
The seven-variety floor in dairy and in fruits or vegetables is the binding constraint for most of these operators. Meeting it requires refrigerated space that many sites do not have and cannot easily add.
The strategic question for a small operator is straightforward. If SNAP redemptions represent a low single-digit share of store revenue, spending $6,700 plus 120 hours to retain authorization may not clear an internal hurdle rate.
The access consequence
Policy analysts have raised the concern that a stocking rule intended to improve nutritional access could reduce access in practice. If stores in low-density or low-income areas exit the program rather than comply, participants in those areas lose the nearest redemption point.
USDA’s position is that the rule raises the floor on what SNAP dollars can buy. Both propositions can hold simultaneously, and the net effect will depend on how many marginal stores actually exit rather than absorb the cost.
How the October cost-sharing shift changes state behavior
A second policy change lands before the stocking deadline. Beginning in October, states with high payment error rates must cover a share of benefit costs that the federal government previously funded in full.
States also take on an increased share of administrative costs starting in fiscal year 2027. Together these provisions convert SNAP from a fully federal benefit obligation into a partially state-funded one, contingent on administrative performance.
The incentive this creates runs in one direction. A state facing financial exposure for payment errors has a direct budgetary reason to tighten verification, which mechanically reduces enrollment further.
That is the most plausible explanation for the spread in the state-level data. States that moved earliest and hardest on verification, including Arizona, Georgia, Florida and Louisiana, show the steepest caseload declines, while California and New Mexico show the shallowest.
How SNAP contraction interacts with tariffs and soft retail sales
The benefit contraction is arriving into an already soft consumer backdrop. US retail and food services sales came in at $763.6bn in July 2026, down 0.6% from June, against forecasts of a modest gain of roughly 0.1% to 0.2%.
The composition was weak in the categories that matter for discretionary demand. Motor vehicle and parts dealers fell 1.8% and nonstore retailers dropped 2.2%, while clothing rose 1.9% and food services edged up 0.5%. The July retail sales print still ran 5.0% above July 2025 on a nominal basis.
Sentiment deteriorated alongside it. The University of Michigan consumer sentiment index fell from 55.2 to 51.0 in August, with one-year inflation expectations ticking up from 4.2% to 4.3%.
The tariff overlay
Cost pressure is building on the supply side at the same time. Section 338 tariffs of 50% on a wide range of Canadian goods take effect on August 19, 2026, covering categories including paper, textiles and household goods, with USMCA origin providing no exemption.
For grocers, the direct food exposure is limited but the general merchandise exposure is not. A supermarket operator absorbing tariff-driven cost increases on non-food categories while losing SNAP-funded food volume faces margin pressure from both ends of the P&L.
The read-through arrives quickly. Walmart reports second-quarter results on August 20 against a consensus of roughly $186.9bn in revenue, and its commentary on trade-down behavior in grocery will be the clearest public signal of how far the benefit contraction has traveled. Our preview of Walmart’s second-quarter print sets out the specific line items to watch.
What happens to a store that misses the deadline
SNAP authorization is not a licence that degrades gracefully. A store that fails the staple food stocking test at review is subject to denial or withdrawal of authorization, which removes its ability to accept benefits at the point of sale.
The practical enforcement mechanism is the authorization review rather than a dated inspection sweep on November 4. Stores are assessed at application, at periodic reauthorization and in response to compliance activity, which means exposure is staggered across the authorized base rather than concentrated on one day.
That staggering is easy to misread as leniency. It is closer to the opposite, because a store that quietly falls short will not learn its status until a review it does not control the timing of.
Why reauthorization timing matters more than the deadline
An operator whose reauthorization falls in late 2026 faces the new standard immediately. One whose cycle falls in 2028 has a longer practical runway, though carrying a non-compliant assortment in the interim remains a live risk.
The sensible planning assumption is that the November 4 date is the point from which non-compliance becomes actionable, not the point at which every store is examined. Treating it as a soft deadline is a bet on review timing rather than on the rule.
What retailers should watch between now and November 4
The compliance window is roughly eleven weeks from mid-August. That is enough time for assortment changes but not enough for significant capital projects such as adding refrigeration.
The first task is an honest variety audit against the distinct-variety framework rather than against SKU count. Most stores that believe they are compliant are counting duplicates.
The second is category triage. Because failing one category fails the whole test, effort should concentrate on the weakest category rather than spreading evenly across four.
The third is a decision on marginal sites. Operators with locations where SNAP redemption is immaterial should model the exit case explicitly rather than defaulting to compliance, since the cost is real and the offsetting revenue may not be. Value-tier operators studying the same math will recognize the pattern from the broader shift toward discount formats in the post-inflation period.
What the data will show first
Enrollment data lags by several months, so the April 2026 figures released in August are the most current national read. The next meaningful update will not clarify whether the decline is stabilizing until late in the year.
Retailer commentary will move faster. Grocery chains reporting third-quarter results in November will be the first to quantify the demand effect and the compliance cost in the same disclosure. Full rule text and authorization guidance are published by the USDA Food and Nutrition Service on its stocking standards rule page.
Frequently asked questions
When exactly do SNAP retailers have to meet the new stocking standards?
The final rule took effect on July 7, 2026, but SNAP-authorized retailers must implement the provisions no later than November 4, 2026. The rule was published in the Federal Register on May 8, 2026.
How many staple food varieties does a store now need?
Seven distinct varieties in each of the four staple food categories, up from three. The categories are dairy, fruits or vegetables, grains, and protein. At least one perishable variety is now required in three of the four categories, up from two.
Which retailers are exempt from the seven-variety requirement?
Specialty stores such as butchers and farm stands are exempt, on the basis that they are built around a single staple category. All other authorized retailers face the same categorical floor regardless of store size.
How much will compliance cost?
A survey by NACS and FMI, the Food Industry Association, estimates about $1bn in upfront costs for convenience stores, $305m for grocers and $215m for supercenters. Convenience stores also face roughly $379m in annual ongoing costs, working out to about $6,700 and 120 hours of labor per store.
Why has SNAP participation fallen so sharply?
The 2025 budget reconciliation law tightened work requirements, raised the age threshold to 65 and removed exemptions for veterans, homeless individuals and former foster youth. It also imposed monthly documentation requirements. The Congressional Budget Office projects a reduction of roughly 2.4 million monthly participants over the next decade.
Which state saw the biggest SNAP decline?
Arizona, where participation fell by more than 50% between April 2025 and April 2026. Georgia fell about 28%, while Florida and Louisiana each fell more than 20%. Alaska was the only state to record an increase, at about 8.1%.
How much of grocery revenue is exposed to SNAP?
More than 80% of SNAP benefits are redeemed at superstores and supermarkets. Roughly 94% of SNAP shoppers spend at least part of their benefits at Walmart, with Amazon at a little more than 52% and Kroger at around 49%.
What changes for states in October?
States with high payment error rates begin covering a share of benefit costs previously funded federally. States also take on an increased share of administrative costs starting in fiscal year 2027, which creates a budgetary incentive to tighten verification.
Could the stocking rule reduce food access?
Policy analysts have argued it might, if stores in low-density or low-income areas drop SNAP authorization rather than absorb the compliance cost. USDA’s position is that the rule raises the minimum quality of food that SNAP dollars can purchase. The net effect depends on how many marginal stores exit.