
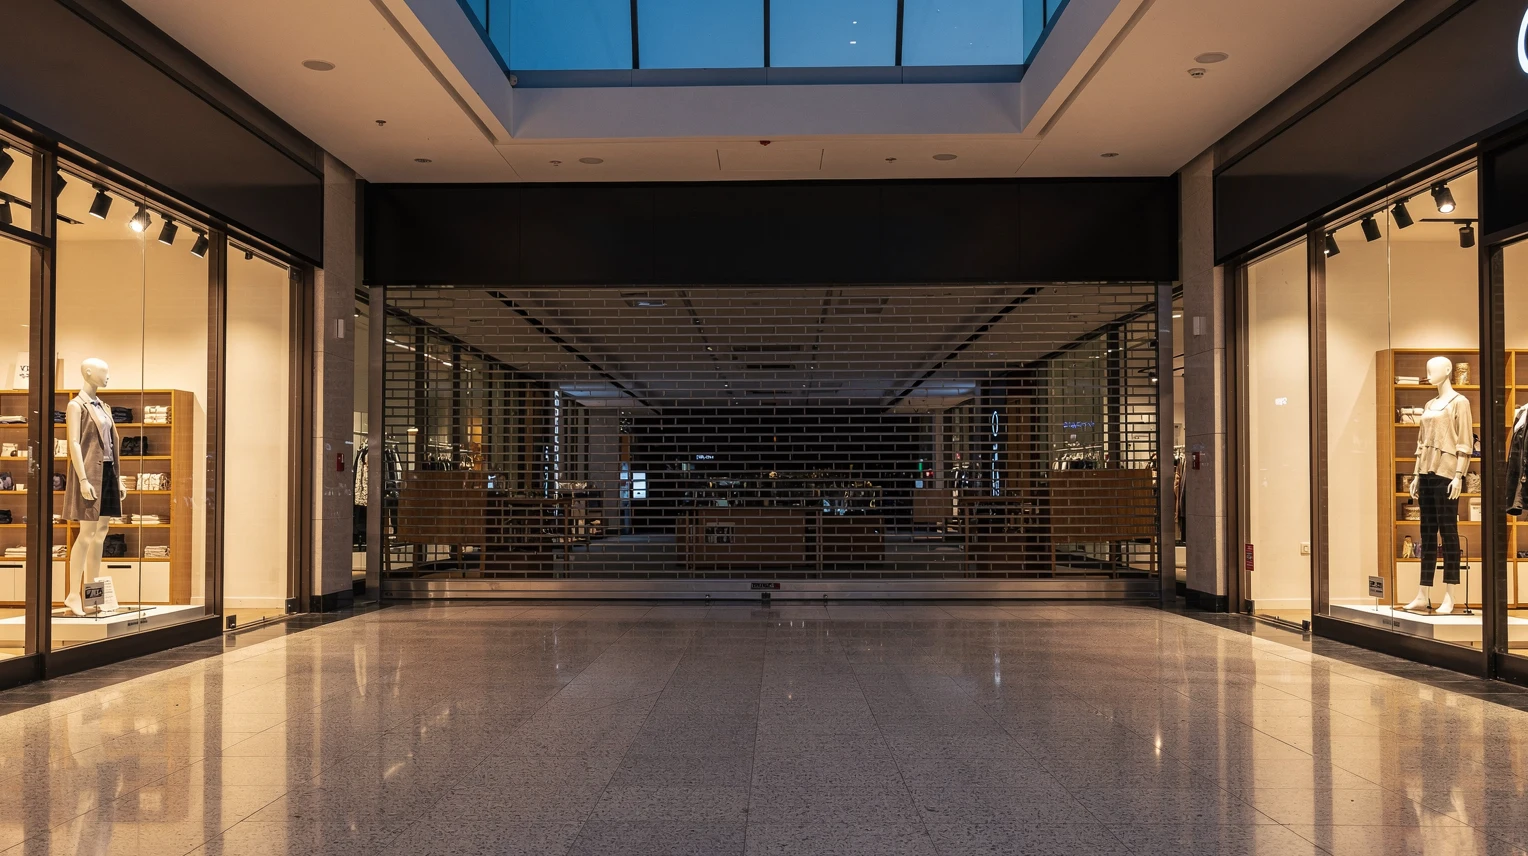
Every closure list looks arbitrary from the outside. A store that seemed busy on Saturday gets shut, while a quieter one three exits down the highway survives. Inside the chain, the list is anything but random: it comes out of a spreadsheet that ranks every location on a handful of numbers, and the same numbers show up whether the chain sells groceries, cosmetics, or sofas. Understanding how retailers decide which stores to close explains most of what looks illogical from the parking lot.
The framework has four layers. The first screen is store-level profitability after rent and labor, known as four wall contribution.
The second is the lease: when it expires, whether it can be broken, and what the landlord will pay to get the space back. The third is the market around the store: how much of its sales would move to a sibling location or to the website if it closed. The fourth is the strategic role the store plays, from returns processing to brand presence, which can keep a loser open and push a modest earner onto the list.
This article walks through each layer in the order a real estate committee would use it, then reads a typical closure announcement the way an analyst does. It sits inside the wider picture of the state of retail across department stores, grocers, and experiences, where the same store economics drive format decisions across every category. The examples are drawn from public filings and press releases; none of the numbers in the worked tables belong to a named company.
In short
- Four wall contribution (store sales minus store costs, before corporate overhead) is the first screen. Stores are ranked, and the bottom decile is examined first, but a negative four wall number alone does not close a store.
- Lease timing decides when a closure is cheap. Natural expiries, kick-out clauses, and landlord buyouts explain why closure lists cluster in specific quarters.
- Sales transfer is the number that turns a loss-making store into a rational closure: if 30 percent of its sales move to a nearby store or online, the chain keeps the margin without the rent.
- Online overlap cuts both ways. Physical stores lift web sales in their trade area, so closing one can reduce e-commerce demand in that ZIP code.
- Strategic stores stay open while losing money when they serve returns, ship-from-store volume, a flagship market, or a lease that is too expensive to exit.
Why four wall contribution is the first screen
The first screen in any closure review is four wall contribution: the profit a store generates from what happens inside its own walls. It is calculated as net sales, minus cost of goods sold, minus the direct costs of operating that specific location: rent and occupancy, store payroll, utilities, local marketing, shrink, and supplies. What it deliberately excludes is anything allocated from headquarters, such as the merchandising team, the distribution network, corporate IT, and executive pay.
The reason chains start here is simple. Corporate overhead does not disappear when a store closes. If a store contributes a positive four wall number, closing it removes that contribution and leaves the overhead to be absorbed by fewer locations. Retail finance teams call this the deleveraging problem, and it is why most chains close far fewer stores than a naive reading of their store-level losses would suggest.
What goes into the four wall number
Most chains build the four wall P&L on a trailing twelve month basis so that seasonality washes out: a store that loses money from January to October but earns its year in December is judged on the full cycle. The structure underneath is the P&L any store operator learns to read: gross margin first, then occupancy, then labor, then everything else.
The occupancy line is usually the swing factor. Two stores with identical sales and identical gross margin can sit at opposite ends of the ranking purely because one signed a lease in 2015 at a mall that has since lost two anchors, and the other signed in 2021 at a discounted rate. In closure reviews, rent per square foot and sales per square foot are usually read together as an occupancy cost ratio, and stores above roughly 15 to 20 percent of sales in occupancy tend to attract scrutiny in apparel and general merchandise, although the threshold varies by category.
Why store-level profit beats sales per square foot
Sales per square foot is the metric that appears in analyst notes and trade press, but it is a poor closure criterion. A high-volume store in a high-rent urban site can have strong sales density and a negative contribution. A low-density store in a paid-off freestanding box can look sleepy on the sales line and sit comfortably in the top half of the profit ranking. Chains rank on contribution dollars and contribution margin, then look at sales density only to understand why a store landed where it did.
A worked example shows how the two measures separate. The three stores below have similar sales, but their occupancy and labor structures put them in very different positions on a closure list.
| Line item (trailing 12 months) | Store A (mall, in-line) | Store B (strip center) | Store C (freestanding, owned) |
|---|---|---|---|
| Net sales | $4.2m | $4.0m | $3.6m |
| Gross margin (38%) | $1.60m | $1.52m | $1.37m |
| Occupancy (rent, CAM, taxes) | $0.84m (20%) | $0.44m (11%) | $0.14m (4%) |
| Store payroll and benefits | $0.55m | $0.50m | $0.46m |
| Other store costs | $0.20m | $0.18m | $0.17m |
| Four wall contribution | $0.01m (0.2%) | $0.40m (10%) | $0.60m (16.7%) |
| Sales per sq ft (approx.) | $420 | $330 | $240 |
Store A has the best sales density and the worst profit. It is the one that goes on the watch list, even though a visitor would see the busiest floor of the three. Store C, with the lowest density, is the most secure, and if the chain owns the building it also has a balance sheet asset that a lease-only store never has.
The allocation trap in closure math
The most common analytical mistake, inside chains as well as outside them, is to load corporate costs onto stores and then close the ones that show a loss. If a chain allocates $150,000 of head office cost to every store and closes forty stores that were “losing” $50,000 each after allocation, it has removed $4 million of positive four wall contribution and kept the $6 million of overhead. The remaining stores now carry more allocation each, and a new bottom decile appears. Chains that fall into this trap end up in a closure spiral, which is one of the patterns described in the analysis of department store closures and how to read the signals.
Better-run reviews instead ask a marginal question: what happens to total company profit if this one store closes and nothing else changes? That forces the team to estimate the second-order effects covered in the next sections.
How lease expiry and break clauses set the timing
A store can sit at the bottom of the four wall ranking for years without closing, because the lease makes leaving more expensive than staying. Commercial retail leases in the United States typically run five to ten years for in-line space and fifteen to twenty for anchors, with renewal options. Exiting before the term ends usually means paying out the remaining rent, or negotiating a termination fee that can amount to a year or more of occupancy cost.
This is why closure announcements cluster. When a chain says it will close 50 stores “by the end of the first quarter,” that date is almost always the point at which a block of leases signed in the same year comes up for renewal. The stores were identified long before; the timing was set by the calendar of the leases.
Kick-out clauses, co-tenancy, and options
Three lease terms govern how much leverage a chain has over timing. A kick-out clause gives the tenant the right to terminate early if sales fall below a stated threshold, usually after a defined number of years. A co-tenancy clause lets the tenant pay reduced rent or leave if named anchors or a stated percentage of the mall’s space goes dark. And renewal options give the tenant, not the landlord, the choice to extend, which means a chain can hold a marginal store cheaply on the option while it waits to see how the market develops.
Co-tenancy is the clause that turned the decline of the enclosed mall into a cascade. When a mall loses one anchor, the in-line tenants can invoke co-tenancy, cut rent, and sometimes leave. The landlord’s income falls, deferred maintenance rises, and the second anchor’s own co-tenancy clause comes into play. The dynamics of that cascade are the subject of the companion piece on mall anchor tenants in the post-mall era.
Why landlords sometimes pay retailers to leave
Not every lease exit costs the retailer money. In a strong center, a landlord who can re-let space at a higher rent may pay the tenant to surrender the lease early. The retailer books a gain, the landlord upgrades the tenant mix, and a store that was marginal in the four wall ranking becomes a profitable closure. Where the landlord cannot re-let, the leverage flips, and chains routinely trade a rent cut for staying.
Bankruptcy and the power to reject leases
The largest closure lists in US retail history came out of Chapter 11 proceedings, and the reason is a specific power in bankruptcy. Under Section 365 of the US Bankruptcy Code, a debtor can reject unexpired leases, which converts the landlord’s claim for future rent into an unsecured claim in the bankruptcy rather than an ongoing obligation. The Code sets a window, initially 120 days after filing with a possible extension, for the debtor to decide which leases to assume or reject; the specifics are set out in Title 11 of the US Code, and the details of any given case depend on the court and the plan.
That mechanism explains why chains that file for Chapter 11 announce closures in waves. The first wave, filed alongside the petition, is the set of stores that were already at the bottom of the four wall ranking and whose leases have no economic value. Later waves come as the debtor sorts the middle of its portfolio and negotiates with landlords who would rather cut rent than take an unsecured claim.
This is general information about how the process works, not legal advice; the outcome for any landlord or tenant depends on the specific case and on advice from a qualified attorney. For a broader reading of how these situations unfold, see the guide to what happens when retail companies restructure.
Does cannibalization make a nearby store the real cause?
The single most important second-order number in a closure review is sales transfer: the share of a closed store’s sales that migrates to other stores in the same chain. Industry rules of thumb, which vary widely by category and by the density of the network, commonly place transfer somewhere between 20 and 40 percent of a closed store’s sales when another location sits within a convenient drive. In dense urban networks, such as drugstores or coffee chains, transfer can be higher; in rural markets with no sibling nearby it is close to zero.
Transfer changes the closure math completely. If a store with $4 million in sales and a $100,000 four wall loss closes, and 30 percent of its sales move to a sibling store that has spare capacity, the sibling picks up roughly $1.2 million in sales at a very high incremental margin, because its rent and most of its labor are already paid. The chain loses a store but gains contribution. The closure was never about the closed store alone; it was about removing overlap.
How chains measure overlap before they close
Modern chains have better data on transfer than a decade ago. Loyalty and card data show which customers shop at more than one location, mobile location data bought from third-party providers shows how trade areas overlap, and earlier closure rounds provide a natural experiment: the sales lift at stores near a closure against stores with none nearby.
The typical process is to draw a drive-time polygon around each candidate, count the siblings inside it, and estimate transfer from prior closures with a similar configuration. Stores inside the polygon of a stronger sibling are the most likely to close; stores that are the only location within a 30-minute drive are protected even on weak numbers, because closing them means losing the market outright.
When the closed store was cannibalizing the survivor
Overlap also runs in the other direction. A chain that expanded aggressively in the 2000s often opened a second store in a market that could support one and a half, and both stores have underperformed ever since. Closing one usually restores the survivor to its earlier sales level, so the review is choosing which of two stores keeps the market, and the decision goes to the one with the better lease, parking, and condition, not necessarily the higher sales today.
A closure that reads as retreat from the outside is often a consolidation that improves the surviving store’s profit.
Does online demand already cover the trade area?
The fourth layer asks whether the website already serves the store’s customers. On a spreadsheet, this looks like a straightforward extension of transfer: if a share of the closed store’s sales will move online, the chain keeps the margin on those sales without the rent. In practice it is more complicated, because the relationship between a physical store and online sales in its trade area runs in both directions.
The halo effect: closures can dent online sales
Research on the halo effect has repeatedly found that a physical store increases online sales in its surrounding area, through brand awareness, returns convenience, and the option to pick up in store. The International Council of Shopping Centers has published work reporting meaningful lifts in web traffic and online sales after a store opens in a market, and corresponding declines after a closure. Chains that have tested this with their own data tend to find the effect is real, though its size varies with the brand and the category.
The consequence is that “online will pick it up” is not a free assumption. A chain that closes its last store in a market frequently sees online sales there fall over the following year, so closure reviews model online transfer conservatively and treat a sole-presence store differently from one of six.
Ship-from-store, returns, and the store as a node
The other complication is that the store may already be doing online work. Many chains route a significant share of e-commerce orders through store inventory, and use stores as the return point for online purchases. A store with weak walk-in sales can be a high-volume fulfillment node that the four wall P&L does not credit, and reviews that miss this close a store that was quietly carrying a region’s fulfillment, then pay for it in shipping times and return handling.
The clean way to think about it is a decision matrix that crosses store-level profit with the strategic role of the location.
| Four wall contribution | Strategic role low (sibling nearby, no fulfillment role) | Strategic role high (sole market presence, fulfillment node, flagship) |
|---|---|---|
| Positive and improving | Keep; candidate for remodel or expansion | Keep; protect the lease with early renewal |
| Positive but declining | Renegotiate rent at expiry; close if landlord will not move | Keep; invest in the store’s online role |
| Negative, lease expiring within 24 months | Close at expiry; model transfer to sibling | Renegotiate; downsize the box if possible |
| Negative, long lease remaining | Seek landlord buyout or sublease; close if a fee is affordable | Keep open; reduce hours and labor to limit the loss |
Most stores that end up on a public closure list come from the bottom-left cell. The bottom-right cell is where the money-losing stores that stay open live, and it is bigger than most outside observers assume.
Can the store actually be staffed?
Labor is usually treated as a cost line rather than a closure criterion, but in tight labor markets it becomes a feasibility question. A store that cannot hold a manager for more than a year, or runs chronically short on evenings and weekends, loses sales and incurs training and overtime costs. Chains track manager turnover and unfilled hours by store, and a consistently understaffed location drifts toward the closure list even when its market looks healthy.
The reverse also holds. A chain that plans to close a store often needs to keep it running through a liquidation period of eight to twelve weeks, and that is difficult if staff leave the moment the closure is announced. Retention bonuses for store staff through the final day are therefore a standard line in closure budgets. A store with a stable core team is worth more than its four wall number implies.
Why some money-losing stores stay open
Every chain carries stores that lose money on a four wall basis and are not on any closure list, for a few recognizable reasons.
- Flagships and brand presence. A store on a major shopping street in a top-tier city may lose money on rent alone, but the chain treats it as marketing. The value shows up in brand awareness, press coverage, and wholesale relationships, none of which appear in the store’s P&L.
- Fulfillment and returns nodes. As described above, a store that handles a region’s ship-from-store volume or online returns is doing work that the four wall statement does not credit. Closing it would push cost into the distribution network.
- Sole market presence. A store that is the only location within a wide radius protects the brand’s online sales in that area and keeps the option to grow if the market improves.
- Lease economics. Where the remaining lease term is long and the landlord will not negotiate, the cost of exiting can exceed several years of the store’s operating loss. The rational choice is to keep it open, cut hours and labor, and wait for expiry.
- Owned real estate. A store the chain owns outright has no rent line and often a positive contribution even on weak sales. Owned stores are more likely to be sold and leased back, or sold for redevelopment, than simply closed.
- Political and contractual commitments. Stores opened with public incentives, or under agreements that require a minimum operating period, may cost more to close than to run.
The list also explains why closure rounds frequently look strange to local observers. The store that closed was busy but on a bad lease with a sibling nearby; the store that stayed was quiet but owned, or alone in its market, or doing fulfillment work behind the stockroom door. The comparison of Macy’s and Nordstrom strategy for the next decade shows this in practice: two chains with overlapping markets have reached different conclusions about which stores are strategic, and their closure lists reflect those conclusions rather than raw store sales.
What a closure announcement tells you about the chain
Public closure announcements follow a formula, and the formula is informative. A chain will state a number of stores, a time frame, the share of the fleet involved, and usually a figure for the sales those stores represent. Reading those four numbers together says a lot about the state of the business.
The numbers to read in the press release
Start with the ratio of stores to sales. If a chain closes 10 percent of its stores and says they represent 3 percent of sales, those were small, weak stores and the move is housekeeping; if they represent close to 10 percent of sales, the chain is closing average stores, and the problem is the format rather than the locations. Macy’s, in its February 2024 announcement, said it would close roughly 150 underproductive stores through 2026 while investing in about 350 that it called go-forward locations; the framing of those 150 as a small share of sales was the point of the announcement.
Next, look at the time frame. Closures spread over three years signal a chain that is waiting for leases to expire and intends to avoid termination fees. Closures concentrated in one quarter signal either a block of expiring leases or a decision to pay to exit, which in turn says the chain expects those stores to lose more money than the exit costs. Walgreens, in October 2024, said it planned to close about 1,200 stores over three years and stated that a substantial share of its US stores were not profitable; the multi-year window told analysts that the company intended to work through lease expiries rather than pay to leave.
Finally, read the language about the remaining fleet. A chain that names the number of go-forward stores and describes investment in them is telling investors that the closure list is the end of the pruning. A chain that says it will “continue to evaluate” its fleet is signaling that more closures are likely, and that the current list is the bottom of the ranking rather than the whole of the problem.
Most healthy chains close a small number of stores every year as leases expire and open a similar number elsewhere, and that rolling program barely registers in the news. A one-time list is different: it means the chain has reviewed the whole fleet at once, usually because a new leadership team, a strategic review, or a lender required it. The signals that precede that kind of review include turnaround-CFO hires, covenant renegotiations, and a new chief executive with a mandate to reset targets.
| Announcement feature | Likely meaning | What to watch next |
|---|---|---|
| Closed stores are a much smaller share of sales than of store count | Fleet cleanup of small, weak locations | Capital spending on remaining stores |
| Closed stores carry a similar share of sales and count | Format problem, not location problem | Changes to store size, assortment, or channel mix |
| Multi-year closure window | Chain will exit at lease expiry to avoid fees | Quarterly updates on the count; possible acceleration |
| Closures concentrated in one quarter | Paid exits or a block of expiring leases | Restructuring charges in the next earnings release |
| “Continue to evaluate the fleet” | More closures likely | Any change in same-store sales at the remaining fleet |
| Closures paired with a stated number of go-forward stores | End of the pruning phase | Whether the go-forward stores actually receive investment |
What closures mean for the local market
The chain’s spreadsheet also predicts what happens next in the town that loses a store. A closure driven by cannibalization means a sibling store within driving distance will get busier, and the chain’s presence in the area continues. A closure driven by a bad lease in a weak center often precedes further closures in that center, because the co-tenancy clauses of the remaining tenants are now in play. And a closure of a sole-market store means the chain has decided the market is not worth the halo it provides, which usually reflects a wider view about the area’s retail spending.
The vacated space matters too: freestanding boxes and strong open-air sites are typically re-let within a year, often to a discount, grocery, or service tenant, while in-line space in a mall that has lost an anchor may sit empty for years. The broad pattern of store closures and re-lettings over the past decade is documented in the Wikipedia entry on the retail apocalypse, and the aggregate trend in physical retail sales that sits behind it is tracked by the US Census Bureau’s monthly retail trade reports.
FAQ on retail store closures
What is four wall contribution and why does it matter for store closures?
Four wall contribution is a store’s sales minus the costs incurred inside that store: cost of goods, rent and occupancy, store payroll, utilities, shrink, and local marketing. It excludes corporate overhead. It matters because overhead does not go away when a store closes, so a store with positive four wall contribution is helping pay for headquarters even if it looks like a loss after allocation. A negative figure triggers a review, not an automatic closure.
Why do chains close busy stores and keep quiet ones?
Because footfall is not profit. A busy store in a high-rent mall can lose money after occupancy costs, while a quieter freestanding store the chain owns can be one of its most profitable. A busy store may also sit close to a sibling location that would absorb much of its sales if it closed, which makes it a rational closure. The quiet store may be alone in its market, or may handle online returns and ship-from-store orders that never show in walk-in sales.
How does the lease affect when a store closes?
The lease sets the cost of leaving. Exiting before expiry usually means paying the remaining rent or a negotiated termination fee, so most chains wait for natural expiry, a kick-out clause tied to sales, or a co-tenancy trigger when anchors leave. That is why closure lists cluster in specific quarters. In Chapter 11, US bankruptcy law allows a debtor to reject leases, which is why bankrupt chains announce closures in waves.
What is sales transfer and how is it estimated?
Sales transfer is the share of a closed store’s sales that moves to other stores in the same chain or to its website. Commonly cited ranges run from 20 to 40 percent when a sibling store is within a convenient drive, and near zero where there is no nearby location. Chains estimate it from loyalty and card data, mobile location data, and prior closures. A high expected transfer rate makes a loss-making store a good closure, because the chain keeps the margin without the rent.
Does closing a store increase online sales in that area?
Usually not. Research on the halo effect, including work published by the International Council of Shopping Centers, has found that a physical store raises online sales in its trade area and that closures tend to reduce them. Closure reviews therefore model online transfer conservatively and treat a brand’s only store in a metro area as worth more than its walk-in sales suggest.
Why do some stores stay open even though they lose money?
The common reasons are flagship status in a major city, a role as a fulfillment or returns node, sole presence in a market, a long lease that costs more to break than to run out, ownership of the building, and contractual or incentive commitments that require a minimum operating period. In each case the store creates value outside its own P&L, or closing costs more than staying, so chains cut hours and labor and wait for expiry.
How can you tell if more closures are coming after an announcement?
Read the wording and the ratios. If the chain names a number of go-forward stores and describes investment in them, the announced list is probably the end of the pruning. If it says it will continue to evaluate the fleet, more closures are likely. If the closed stores account for a similar share of sales as of store count, the problem is the format rather than specific locations, and a multi-year window signals exits at lease expiry rather than paid terminations.
Next steps
The closure framework is one piece of a wider picture in which chains are rebalancing between formats, and the fuller account of that rebalancing sits in the guide to the state of retail. For the reasons chains are reinvesting in the stores they keep, the piece on why department stores are reinventing themselves in 2026 covers what a go-forward store is being asked to do that the closed ones were not.