
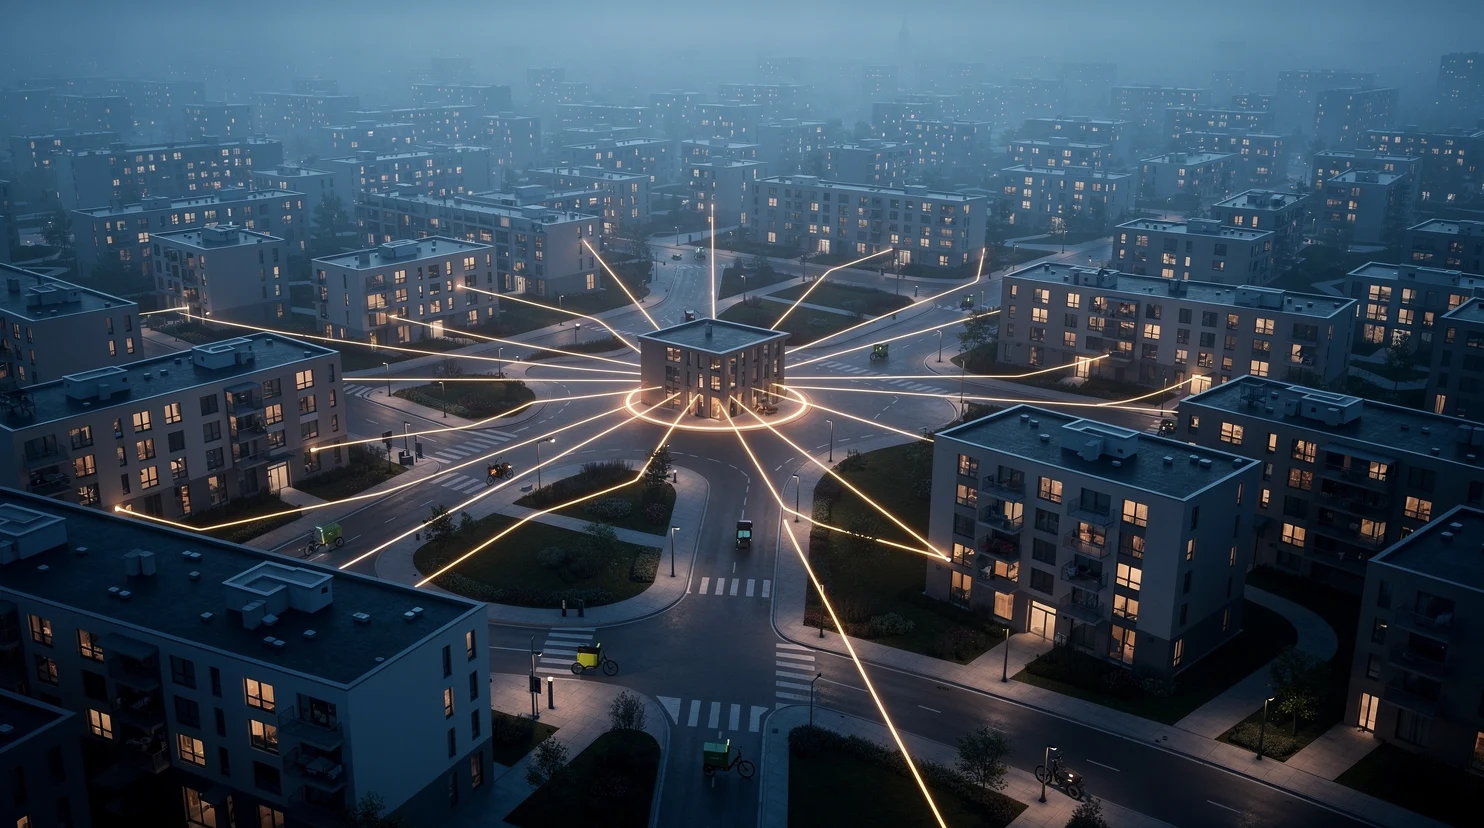
Every rapid delivery promise, whether it says 15 minutes or two hours, is a bet on delivery drop density: how many completed orders one rider can fit into one paid hour. When that number climbs from two drops to four, the labor cost of each order roughly halves, and a business that looked hopeless on paper starts to look like a business. When it slips below two, no amount of marketing spend or basket-size growth can rescue the unit economics.
This article walks through the arithmetic behind that claim. It covers how batching, delivery radius, rider utilization and fleet structure combine into a cost per order, why weather and peak-hour demand break tidy plans, and how to put the whole thing into a spreadsheet you can argue with. It is the operational companion to our quick commerce guide covering dark stores and rapid delivery economics, which explains the business model at a higher altitude.
In short
- Drop density (completed deliveries per paid rider hour) is the single biggest driver of last-mile labor cost in rapid delivery; the relationship is a curve, not a line, and the early gains are the largest.
- Batching two or three orders on one trip multiplies effective density, but only inside a narrow window where the second order arrives before the first has to leave.
- Delivery radius trades reach for speed: doubling the radius quadruples the catchment area but also stretches every trip, which drags density back down.
- Rider utilization, the share of paid time spent moving a parcel, is usually where the money leaks; idle minutes between orders cost as much as riding minutes.
- A spreadsheet model with six inputs (wage, drops per hour, batch rate, radius, utilization, order value) is enough to tell whether a delivery promise can ever pay for itself.
Why does cost per drop fall as density rises?
The short answer: a rider hour is a mostly fixed cost, and density decides how many orders share it. If a rider costs an operator $22 per hour fully loaded (wage, insurance, equipment, supervision) and completes two drops in that hour, each drop carries $11 of labor. Complete four, and the figure is $5.50; complete six, and it is $3.67. The rider was paid the same in every case; only the denominator changed.
The fixed hour and the marginal drop
Most of what a rider is paid for does not scale with the number of orders. Waiting at the store, riding to the first address, riding back, charging a battery and handling a customer who is not home are all time costs that exist whether the bag holds one order or three. The genuinely variable part, the extra minutes to make one more stop when the route already passes nearby, is small. That gap between fixed and marginal cost is what makes density so powerful.
Operators sometimes describe this as “the second order is nearly free.” That is an exaggeration, but the direction is right: in a dense urban zone a second stop on an existing route often adds three to five minutes, while a first stop on a fresh route, including the return leg, can consume 15 to 20.
The density curve is steep early and flat late
Because cost per drop equals hourly cost divided by drops per hour, the savings follow a hyperbola. Moving from one to two drops per hour cuts labor cost per order by 50 percent; from four to five, 20 percent; from eight to nine, about 11 percent. The first few density gains are worth fighting for; the last few are worth much less than the service degradation they usually require.
| Drops per rider hour | Labor cost per drop at $22/hour | Saving versus previous row | Typical operating context |
|---|---|---|---|
| 1.0 | $22.00 | n/a | Suburban launch zone, no batching, long radius |
| 2.0 | $11.00 | 50% | Early urban zone, occasional batching |
| 3.0 | $7.33 | 33% | Established dense zone, routine two-order batches |
| 4.0 | $5.50 | 25% | Mature city-center zone, three-order batches at peak |
| 5.0 | $4.40 | 20% | Very dense high-rise catchment, tight radius |
| 6.0 | $3.67 | 17% | Rare outside the densest global cities |
The figures above are illustrative; the $22 hourly figure is a modeling assumption, not a market average. Real fully loaded costs vary by country, employment model and whether the operator supplies the vehicle. Rider hourly compensation in the United States can be sanity-checked against the couriers and messengers occupational data published by the Bureau of Labor Statistics, then loaded with the operator’s own overhead rate.
Why density is a geography problem before it is a routing problem
Drops per hour is bounded above by how many customers physically live within a short ride of the store. A dark store surrounded by 40,000 households inside a one-mile radius can support densities that a store with 6,000 households in the same radius cannot, regardless of how clever the dispatch algorithm is. This is why quick commerce operators concentrate on high-rise, high-income, high-frequency neighborhoods first and treat suburban expansion with caution. The same logic governs conventional parcel economics, covered in our piece on delivery density and why shipping cost depends on your map.
How do you batch two or three orders without breaking the promise?
Batching means one rider carries two or more orders on a single trip. It is the fastest route to higher density, and also the fastest route to broken promises if the delivery window is tight. The trick is that batching only works inside a time window that opens when the first order is picked and closes when it must leave the store to arrive on time.
The batching window explained
Suppose the promise is 20 minutes and picking takes four. The first order is ready at minute four and needs roughly ten minutes of riding to a customer at the edge of the zone, so it must leave by minute ten. That leaves a six-minute window during which a second order, if it arrives and can be picked, may ride along. Widen the promise to 30 minutes and the window grows to about 16 minutes; the probability of a compatible second order roughly triples.
Order arrival rate decides what happens inside that window. At two orders per hour, the chance of a second order landing in a six-minute window is low, and it will rarely be heading in the same direction. At 30 orders per hour, several candidates will appear, and dispatch can choose the one that adds the least detour. Batching is therefore a byproduct of scale, not a substitute for it.
Detour cost and the direction test
A second order is only worth batching if the detour it adds is smaller than the cost of a separate trip. Dispatch systems typically score candidate pairs on added distance and added time to the first customer. A commonly used rule in operations teams is that the second stop should add no more than 25 to 35 percent to the first trip’s ride time, and the first customer should not wait more than two to three extra minutes.
Direction matters more than distance. Two customers 600 meters apart but on opposite sides of the store are a bad batch; two customers 900 meters apart along the same arterial road are a good one. Effective batching depends on the store’s catchment shape and street grid at least as much as on the algorithm.
Triple batching and the service cliff
Three-order batches move the density needle again, but the third customer is the one who feels it, and late customers reorder less. Many operators cap batches at two during tight-promise hours and allow three only when the promise is relaxed (evenings, rain surcharges, scheduled slots). The right cap is empirical: measure repeat-order rate for customers who were third in a batch versus first, and set the cap where the repeat-rate loss outweighs the labor saving.
Store-side execution shapes this too: slow pick paths and staging shrink the batching window before the rider sees it. The layout and staffing choices that keep picking under four minutes are covered in the companion article on dark store operations, pick paths and staffing.
What does delivery radius trade off between reach and speed?
Radius is the most tempting lever and the most dangerous. Expand the circle and the catchment gains customers; but the average trip gets longer, the promise gets harder to keep, and density falls. Because area scales with the square of radius while ride time scales linearly, the two effects pull in opposite directions and the optimum is usually smaller than founders want it to be.
Area, households and ride time by radius
| Radius | Catchment area | Households at 8,000 per sq mile | Average one-way ride (e-bike, 10 mph effective) | Feasible promise |
|---|---|---|---|---|
| 0.5 mile | 0.79 sq mi | ~6,300 | ~2 minutes | 10–15 minutes |
| 1.0 mile | 3.14 sq mi | ~25,000 | ~4 minutes | 15–20 minutes |
| 1.5 miles | 7.07 sq mi | ~56,500 | ~6 minutes | 20–30 minutes |
| 2.0 miles | 12.57 sq mi | ~100,500 | ~8 minutes | 30–45 minutes |
| 3.0 miles | 28.27 sq mi | ~226,000 | ~12 minutes | 45–60 minutes |
The household density figure is a round assumption chosen for illustration. Actual figures for any US zone can be pulled from the US Census Bureau at block-group level, and the difference between a Manhattan block group and a suburban one can exceed 20x. Average ride time also assumes a uniform distribution of customers, which is never true; a river, a rail line or a highway on one side of the store can cut effective catchment in half.
Why the outer ring costs more than it earns
Customers in the outer third of a circular zone occupy over half its area but account for the longest trips, the least batchable orders and the most late deliveries, and mapping cost per order by distance band almost always shows the outer ring losing money even at the same basket size. The common fix is not to shrink the whole radius but to shape it: cut the zone along natural barriers, exclude low-density pockets and extend it along dense corridors where riders already pass.
Radius and the promise are one decision
The promise cannot be set independently of the radius. A 15-minute promise implies a radius of roughly one mile or less on an e-bike in city traffic; a 45-minute promise supports two to three miles. Advertising the tight promise while quietly serving the wide radius means paying for both: the labor of long trips and the churn of missed windows. The broader economics of choosing a promise, including when same-day beats instant, are set out in our analysis of same-day delivery economics and when it works for retailers.
How much do rider utilization and idle time cost?
Utilization is the share of paid rider time spent doing productive work: riding to a customer, handing over, riding back to a position where the next order can be picked up. Everything else is idle. In a typical rapid delivery operation, idle time is the largest hidden cost, because it is paid at the full hourly rate and produces nothing.
Where idle minutes come from
Idle time accumulates in four places: waiting at the store for orders still being picked, waiting after returning because the next order has not arrived, riding back empty from the last drop instead of repositioning toward the next likely order, and waiting at the customer’s door. On high-rise deliveries, door waiting alone can consume more minutes than the ride itself.
Each of these has a different fix. Store waiting is a picking-speed problem; post-return waiting is a demand-forecasting and shift-planning problem. Empty return legs are a dispatch problem, solvable with mid-zone staging points. Door waiting is a product problem: building access notes, lobby handoff options and a two-minute contact rule cut it sharply.
Utilization targets and what they imply
Well-run dense zones commonly aim for utilization in the 60 to 75 percent range during core hours. Below 50 percent, the operation is paying two riders to do one rider’s work. Above 80 percent, the system has no slack, and any spike in orders or drop in rider availability cascades into late deliveries. The gap between 50 and 70 percent utilization is worth roughly the same as the gap between two and three drops per hour in the cost model, which is why it deserves equal attention.
Drops per paid hour equals drops per active hour multiplied by utilization. A zone that achieves five drops per active hour at 50 percent utilization delivers 2.5 drops per paid hour, no better than a slower zone with higher utilization. Both numbers must move together.
Shift structure as a utilization tool
Demand for rapid delivery is lumpy: a lunch spike, a long evening peak and troughs in between, so flat eight-hour shifts guarantee idle time in the troughs and shortages at the peaks. Split shifts, short peak-only shifts and a small on-call pool raise utilization without adding riders. The staffing arithmetic is the same one that governs pick-and-pack labor upstream, which we discuss in the broader guide to modern retail logistics from warehouse to doorstep.
How do employed riders and gig fleets compare in the cost model?
The employment model changes which costs are fixed and which are variable, and therefore how much density matters. Employed riders are a fixed hourly cost; density lowers their cost per drop directly. Gig riders paid per delivery are a variable cost per order; density lowers the operator’s cost only if the per-delivery rate is renegotiated downward, which in practice is constrained by whether riders can earn a living at that rate.
| Dimension | Employed riders (hourly) | Gig fleet (per delivery) | Hybrid (core employed + gig overflow) |
|---|---|---|---|
| Cost behavior | Fixed per hour; falls per drop as density rises | Variable per drop; flat regardless of density | Fixed base, variable peak |
| Who bears idle time | Operator | Rider | Operator for core, rider for overflow |
| Peak coverage | Requires forecasting and shift design | Requires surge pay to attract supply | Core covers baseline, gig absorbs spikes |
| Service consistency | Higher; trained, uniformed, dispatch-controlled | Variable; riders may multi-app and decline orders | High for core, variable at peak |
| Regulatory exposure | Payroll taxes, benefits, scheduling laws | Worker classification rules vary by jurisdiction and are changing | Both |
| Best fit | Dense zones with predictable volume | Low-volume or new zones, extreme peaks | Most mature multi-zone operators |
Why gig looks cheap in the first year and expensive in the third
Gig fleets are attractive when a zone is new, because the operator pays only for completed drops and carries no idle cost while demand is thin. As density rises, the picture inverts.
An employed rider at $22 per hour doing four drops per hour costs $5.50 per drop; a gig rider paid $7 per delivery costs $7 regardless. The crossover point, where employed becomes cheaper, is simply the hourly cost divided by the per-delivery rate: at $22 and $7, it is a little over three drops per hour. Above that density, the employed model wins on labor cost alone, before counting service consistency.
The classification question is not settled
Whether gig riders are contractors or employees is decided differently across jurisdictions and has shifted repeatedly through legislation and court rulings in the United States, the United Kingdom and the European Union. Operators modeling a gig fleet should treat classification risk as a line item, and anyone making decisions on it should consult employment counsel in the relevant jurisdiction rather than rely on a general article. This piece describes cost mechanics, not the legal position in any specific market.
What the exits taught the market
The quick commerce consolidation of 2022 to 2024, in which several venture-funded operators sold, merged or withdrew from markets, is widely read by analysts as a density story: wide radii and employed fleets in thin zones put fixed labor cost against low drops per hour. That pattern is the central lesson of our quick commerce guide, and the numbers in this article are the mechanism behind it.
How do weather, traffic and peaks break the plan?
A density model built on average conditions will be wrong on the days that matter most. Rain, snow, heat, road closures and the Friday evening surge all push effective drops per hour down at exactly the moment order volume goes up. Planning for the average is planning to miss the peak.
Weather cuts speed and raises demand at the same time
Rain increases order volume for many rapid delivery categories because customers who would have walked to a shop stay home. It also slows riders, lengthens door waits and raises the rate of riders calling in unavailable. The combination can push drops per hour down by a third while orders rise by a similar share, which doubles the effective supply gap. Operators that surcharge in bad weather are not merely capturing willingness to pay; they are rationing a rider hour that has become genuinely more expensive.
Traffic changes the map by hour
A one-mile radius that supports a 15-minute promise at 10 a.m. may only support 25 minutes at 5:30 p.m. Sophisticated dispatch systems adjust the effective radius by time of day, quietly shrinking the deliverable zone or extending the displayed promise during congestion. Simpler systems keep a static zone and absorb the lateness. The first approach protects density; the second protects the marketing claim and pays for it in churn.
Peaks and the cost of coverage
Peak-hour demand in rapid delivery can run at three to five times the daily average; staffing to the peak leaves riders idle most of the day, and staffing to the average guarantees late orders at peak. The usual compromise is a layered supply: employed core riders covering roughly the 60th percentile of hourly demand, a flexible on-call pool for the 80th, and gig overflow or extended promises above that. Every layer has a different cost per drop, and the blended figure is what belongs in the model.
The peak problem is also why some retailers conclude that instant delivery is the wrong product altogether and steer customers toward collection. The economics of that alternative, and why it keeps beating delivery on margin, are laid out in our piece on buy online, pick up in store and why the model still beats delivery.
How do you build a simple cost per order model in a spreadsheet?
A working model needs six inputs and about a dozen formulas. It will not replace a dispatch simulator, but it will tell you, in an afternoon, whether a proposed promise and radius can ever reach breakeven. Build it before signing a lease on a dark store, not after.
The six inputs
- Fully loaded rider cost per hour: wage plus employer taxes, insurance, equipment amortization and supervision. For gig fleets, enter the per-delivery rate instead and skip the utilization row.
- Drops per active hour: how many single deliveries a rider completes when continuously working, driven mainly by radius and street layout. Start with two for a new zone and test up to five.
- Batch rate: the share of trips carrying two or more orders, and the average orders per batched trip. A mature zone might run 40 percent of trips batched at an average of 2.2 orders.
- Utilization: the share of paid time spent on productive work. Use 55 percent for a new zone, 70 percent as a stretch target.
- Average order value and contribution margin before delivery: what each order earns after product cost and store labor, before paying the rider.
- Delivery fee and tip revenue per order: what the customer pays toward the cost, net of any promotional discounts.
The formulas that matter
Effective orders per active hour equals drops per active hour multiplied by the average orders per trip, where average orders per trip equals one plus (batch rate multiplied by (average batch size minus one)). With four drops per active hour, a 40 percent batch rate and an average batch of 2.2, that is 4 × (1 + 0.4 × 1.2) = 5.92 orders per active hour.
Orders per paid hour equals effective orders per active hour multiplied by utilization. At 65 percent utilization, the zone above delivers 3.85 orders per paid hour. Labor cost per order equals hourly cost divided by orders per paid hour: $22 ÷ 3.85 = $5.71. Add packaging, insurance claims, and a per-order allowance for refunds and re-deliveries (often $0.50 to $1.50) to get all-in delivery cost per order.
Delivery margin per order equals delivery fee plus tip revenue minus all-in delivery cost. Order contribution equals pre-delivery contribution margin plus delivery margin. If order contribution is negative at the density you can realistically reach in twelve months, the promise is wrong, the radius is wrong or the basket is too small.
Sensitivity: which input moves the answer most
Run the model with each input moved 20 percent up and down while holding the others fixed. In most zones, drops per active hour and utilization dominate; a 20 percent change in either moves labor cost per order by roughly 17 percent. Batch rate matters less than operators expect until the zone is already dense.
A model like this is only as honest as its drops-per-hour assumption, and the safest way to set it is from the store’s actual catchment: households within the radius, barriers that cut it, and the building types that determine door-wait time. If you have never mapped a delivery zone before, the fundamentals are covered in our primer on last-mile delivery explained for retailers who never thought about it.
Common mistakes in density planning
The recurring errors are predictable because the incentives behind them are predictable: growth targets pull toward wider radii, marketing toward tighter promises, finance toward gig fleets in year one.
- Modeling the average day. The plan works Tuesday at 11 a.m. and fails Friday at 6 p.m. in the rain. Model the 80th percentile hour, not the mean.
- Treating radius as a growth lever. Each extra half mile adds long trips that lower density. Grow by opening a second store, not by stretching the first.
- Counting drops per active hour and calling it density. Paid hours are what hit the P&L. Track utilization separately and multiply.
- Batching past the service cliff. The third order in a batch saves a dollar and can cost a customer. Measure repeat rate by batch position.
- Ignoring door time. High-rise lobbies and gated buildings can add more minutes than the ride. Product fixes (access notes, lobby handoff) are cheaper than rider hours.
- Setting the promise before the radius. They are one decision. A 15-minute promise on a two-mile zone is a plan to be late.
FAQ on batching and delivery density
What is delivery drop density?
Delivery drop density is the number of completed deliveries a rider makes per paid hour. It is the main driver of labor cost per order in rapid delivery, because a rider hour is a largely fixed cost that every order in that hour shares. Operators sometimes quote drops per active hour instead, which excludes idle time; the paid-hour figure is the one that reflects true cost. A dense urban zone might reach four to five drops per paid hour; a thin suburban zone may struggle to reach two.
How many orders can a rider batch on one trip?
Two is routine in dense zones and three is common when the delivery promise is relaxed. Beyond three, the last customer’s wait grows enough that repeat-order rates usually fall, which cancels the labor saving. The practical cap depends on the promise: a 15-minute window rarely allows more than two, while a 45-minute or scheduled window can support three or four. Bag capacity, temperature-sensitive items and the physical size of e-bike storage also limit batching in grocery categories.
What delivery radius supports a 15-minute promise?
Roughly one mile or less on an e-bike in city traffic, and often closer to three-quarters of a mile once picking time and door time are counted. At an effective 10 mph, a one-mile ride takes about six minutes; add four minutes of picking and a couple of minutes at the door and the 15-minute window is nearly gone. Operators that run wider zones under a 15-minute banner typically either miss the window on outer-ring orders or display a longer estimate for those addresses.
Is it cheaper to use employed riders or gig couriers?
It depends on density. Gig couriers paid per delivery are cheaper when a zone is new and drops per hour are low, because the operator pays nothing for idle time. Employed riders paid hourly become cheaper once density passes the crossover point, which equals hourly cost divided by the gig per-delivery rate (a little over three drops per hour at $22 against $7). Worker classification rules vary by jurisdiction and should be checked with employment counsel.
What is a good rider utilization rate?
Mature dense zones commonly target 60 to 75 percent utilization during core hours, meaning that share of paid time is spent riding to, handing over or repositioning after a delivery. Below 50 percent the operator is paying heavily for waiting. Above 80 percent there is no slack, and any surge in orders or drop in rider availability immediately produces late deliveries. Utilization is improved through better demand forecasting, split shifts, mid-zone staging points and product fixes that cut door waiting time.
How does bad weather affect delivery cost per order?
Weather raises cost from both sides. Rain and snow push order volume up because customers stay home, while slowing riders, lengthening door waits and reducing rider availability, so effective drops per hour can fall by a third just as orders rise by a similar share. Operators respond with weather surcharges, extended displayed promises, temporary radius reductions and on-call rider pools. A cost model built on average-weather assumptions will understate peak-day cost significantly.
How do I calculate labor cost per delivery?
Divide fully loaded rider cost per hour by orders per paid hour. Orders per paid hour equals drops per active hour, multiplied by average orders per trip (which rises with batching), multiplied by utilization. For example, four drops per active hour with a 40 percent batch rate averaging 2.2 orders gives 5.92 orders per active hour; at 65 percent utilization that is 3.85 orders per paid hour; at $22 per hour the labor cost is about $5.71 per order. Add packaging, refunds and re-delivery allowances to reach all-in delivery cost.
Why did so many quick commerce companies fail on density?
Many operators launched wide delivery zones with employed fleets in cities where household density could not support more than one or two drops per paid hour, so labor cost per order exceeded the basket’s entire contribution margin. Analysts widely attribute the 2022 to 2024 consolidation and market exits to that mismatch. Survivors generally run tighter zones, hybrid fleets and relaxed promises outside peak hours, which lifts density to where the arithmetic closes.
What to do next
Build the six-input model before committing to a promise, and test it against the 80th percentile hour rather than the average. If the zone cannot reach three drops per paid hour within a year, the cheaper answer is usually a longer promise or a collection option rather than more riders. For the wider picture on where rapid delivery fits alongside dark stores, assortment and the real margins in the category, the quick commerce guide brings the whole model together.