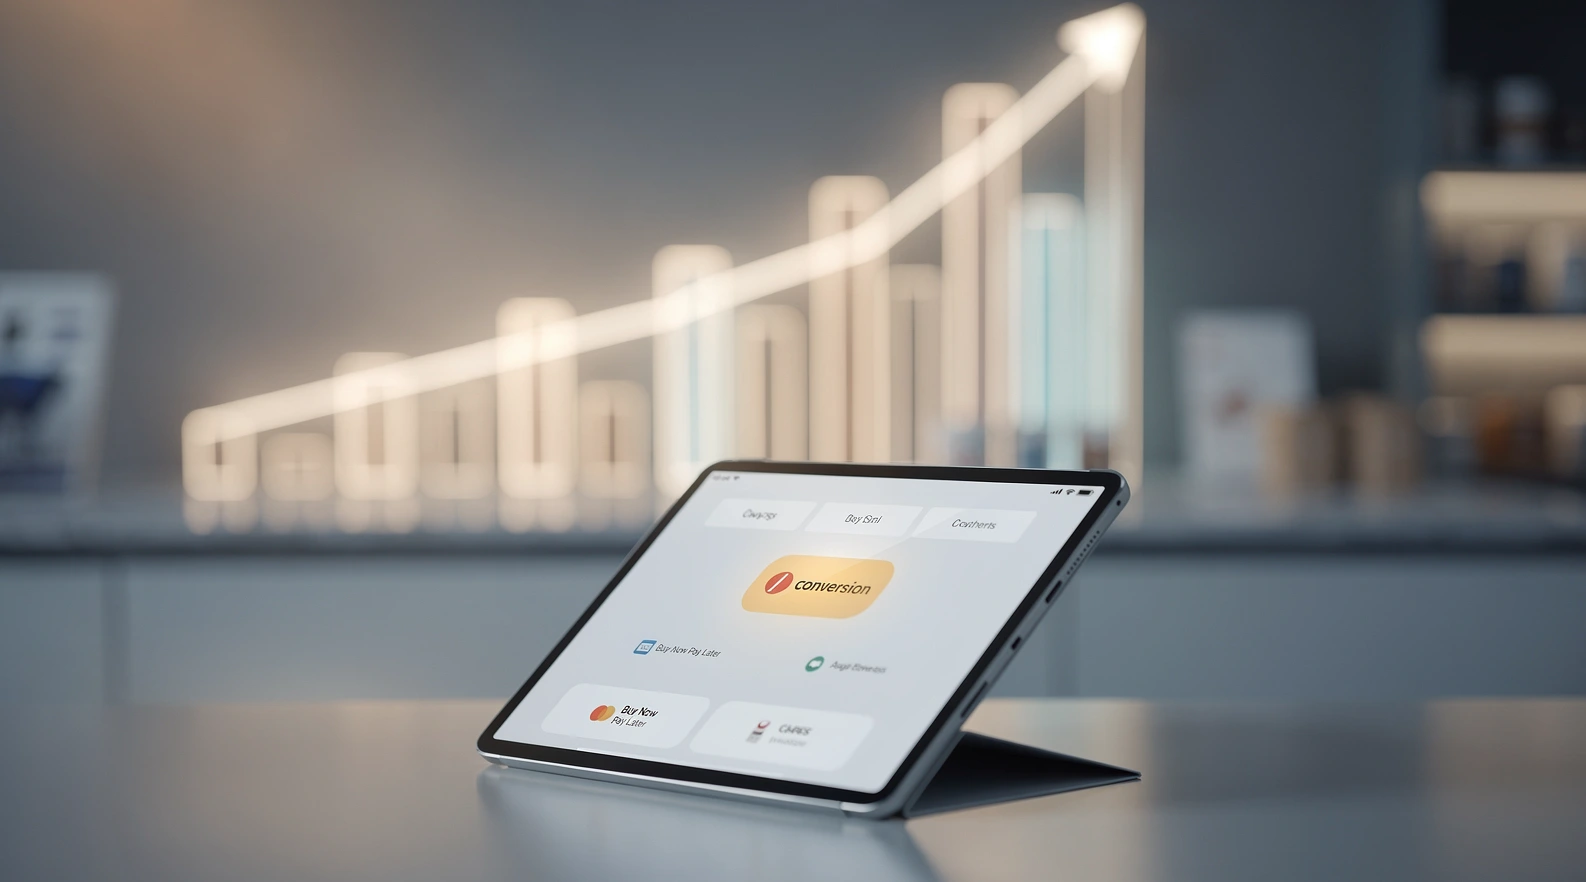
Buy now, pay later (BNPL) has moved from novelty checkout button to mainstream payment lane in US retail. The pitch from providers is simple: offer BNPL, watch conversion climb. The reality, after several years of US-wide data and merchant case studies, is messier. BNPL lifts conversion in some carts and barely moves the needle in others, and a small number of stores see it cannibalize debit and card payments without growing revenue at all.
This guide unpacks what bnpl conversion rate retail actually looks like in 2026, where the lift is real, where it is an illusion, and how to test BNPL on your own store without burning budget on a vendor that does not fit your cart. It sits inside the wider retail payments guide on ShopAppy and assumes you are looking for working numbers rather than vendor marketing.
In short
- Average lift: Well-implemented BNPL adds 10 to 20 percent to cart-level conversion on baskets above $80, with the biggest impact on apparel, home goods, and electronics.
- Average order value (AOV): AOV typically rises 30 to 50 percent when BNPL is present and prominently placed at product page, not just checkout.
- Watch out for cannibalization: On baskets under $50, BNPL can shift payment mix without growing revenue, while adding fees of 3 to 6 percent.
- Placement beats provider: The biggest conversion gains come from BNPL messaging on product detail pages, not from picking a specific provider.
- Test before you commit: Run a six-to-eight-week A/B on a category subset before signing a multi-year contract.
Why BNPL conversion talk often misleads retailers
Most public BNPL conversion numbers come from the providers themselves: Affirm, Klarna, Afterpay, PayPal Pay in 4, Zip, and Sezzle. Their reports usually show eye-catching figures like “85 percent higher AOV” or “30 percent conversion lift.” Those numbers are real, but they describe a self-selected slice of carts where the customer already chose BNPL. They do not describe what happens to your overall store conversion when you switch the option on.
The reliable benchmark is the difference in checkout completion rate for sessions where BNPL is visible versus not visible, holding everything else constant. According to consumer payment trend tracking from the Federal Reserve, roughly one in seven US adults used BNPL in the past year, and usage skews to ages 25 to 44 and to baskets where the customer feels the price stretches a normal budget. That is a specific audience, not the whole store.
So the honest framing is: BNPL is one more payment lane, like Apple Pay or PayPal. It widens the funnel for a sub-segment of shoppers and adds friction (cost, refunds, disputes) you have to manage. Whether it lifts your store conversion meaningfully depends on cart composition, audience, and how visibly you communicate it.
Key terms you will see in BNPL conversion reports
Before diving into numbers, four definitions matter because providers use them inconsistently.
Conversion rate
The share of sessions or unique visitors that complete a purchase. For BNPL analysis, the useful version is checkout conversion: sessions that reached the cart and completed payment. Site-wide conversion mixes too many traffic sources to be a clean signal.
Approval rate
The share of customers who select BNPL at checkout and get approved by the lender. In 2026 this sits between 60 and 80 percent across major US providers, with declines hitting younger and lower-credit shoppers hardest. A high approval rate is good for conversion; a low one creates a friction spike right at checkout.
Attach rate
The share of completed orders that used BNPL. In US retail, healthy attach rates are 8 to 18 percent of orders for apparel and home, 4 to 10 percent for general merchandise, and under 3 percent for grocery and convenience.
Incremental conversion
The cleanest metric and the hardest to measure: the share of completed orders that would not have happened without BNPL. Providers rarely volunteer this number because it is usually smaller than headline lift figures. Estimating it requires holdout testing.
How BNPL actually changes checkout behavior
BNPL changes three things at the cart. It removes a perceived budget ceiling, it splits the visible price, and it adds a new approval gate. Each one cuts in a different direction.
Removing the budget ceiling is where most lift comes from. When a shopper sees “4 payments of $37.50” instead of “$150 today,” the cart feels lighter. This effect is strongest on baskets that sit just above the customer’s comfortable spend, which for US e-commerce shoppers in 2026 averages around $80 to $130 depending on category. Below that band, BNPL adds little because the price already feels affordable. Far above it, BNPL alone is not enough; the shopper still bails.
Splitting the price increases AOV because shoppers fill larger baskets when each item shows a smaller installment. This is real and consistent across providers, with typical AOV uplift of 30 to 50 percent on BNPL-paying carts. The catch: AOV uplift only matters if the volume of BNPL carts is large enough to move overall store AOV. A 50 percent AOV bump on 10 percent of orders is a 5 percent lift on store AOV.
The approval gate cuts the other way. When a customer picks BNPL and gets declined, they often abandon rather than switch to a card. Providers with weaker approval engines or stricter limits can drag total checkout conversion down even while looking great on the carts they do approve.
What the numbers look like by category
BNPL impact varies sharply by category. The table below summarizes typical 2026 US benchmarks pulled from merchant case studies, payment partner reports, and the Adobe Digital Economy Index across apparel, electronics, home, and general merchandise.
| Category | Typical AOV without BNPL | AOV uplift with BNPL | Checkout conversion lift | BNPL attach rate |
|---|---|---|---|---|
| Apparel and accessories | $85 | +45% | +12 to 18% | 14% |
| Home and furniture | $220 | +55% | +15 to 22% | 17% |
| Electronics | $310 | +30% | +8 to 14% | 11% |
| Beauty and personal care | $60 | +25% | +5 to 9% | 6% |
| Grocery and convenience | $45 | +10% | +1 to 3% | 2% |
| Sports and outdoors | $140 | +38% | +10 to 16% | 12% |
The pattern is clear: BNPL works best where the basket is large enough to feel like a real spending decision, and where the customer can imagine spreading the cost. Grocery is the floor; furniture and home are the ceiling.
If your store sits in a high-impact category, the question shifts from “should we offer BNPL” to “how do we maximize the lift.” If you sit in a low-impact category like grocery or fast fashion under $40, BNPL is mostly a brand and parity play, not a growth lever.
Where placement makes more difference than the provider
One of the most consistent findings across merchant case studies is that BNPL placement matters more than BNPL provider. Stores that put installment messaging only on the final checkout step see roughly half the conversion lift of stores that surface it on product detail pages, in cart drawers, and in marketing emails.
The reason is simple: the customer needs to know the BNPL option exists before they decide whether the price is acceptable. By the time they reach checkout, the spend ceiling decision is already made. Surfacing “or 4 payments of $X” on the product page resets that decision earlier in the journey.
Practical placement rules that hold up across most retailers:
- Show installment price under the product price on product detail pages for items over $50.
- Include BNPL logos in the cart drawer so the option is visible before the customer commits to checkout.
- Mention BNPL in cart abandonment emails for carts over the category threshold.
- Keep checkout itself clean: BNPL alongside card, Apple Pay, and PayPal, not stacked above them.
- Avoid promoting BNPL on low-margin or low-price items where the math does not work.
If you have not done this layered placement, you are leaving most of the lift on the table no matter which provider you pick.
Common mistakes that quietly kill BNPL conversion
The same handful of execution mistakes shows up over and over in US retail BNPL rollouts.
Mistake 1: Treating BNPL as a checkout-only feature. Covered above. The shop fails to move installment messaging upstream and wonders why attach rate is half of industry benchmark.
Mistake 2: Bolting on three or four BNPL providers. Some retailers offer Affirm, Klarna, Afterpay, and PayPal Pay in 4 simultaneously, hoping to catch every shopper. This usually backfires. Checkout becomes cluttered, customers freeze on choice, and merchant fees stack up. Two providers is usually the sweet spot: one premium (Affirm or Klarna) and one mass-market (Afterpay, Pay in 4, or Sezzle).
Mistake 3: Ignoring the refund and dispute path. BNPL refunds flow through the lender, not directly back to the card. Customer service teams that are not trained on this generate angry tickets and chargebacks. Map the refund and partial-refund flow with each provider before launch, not after.
Mistake 4: Choosing the provider with the lowest merchant fee. BNPL merchant fees typically range from 2 to 6 percent. A two-point fee gap often hides a 10-point gap in approval rate and a worse customer experience. Cheap providers with weak approval engines can cost more in lost conversion than they save in fees.
Mistake 5: Skipping the holdout test. Plenty of retailers launch BNPL across the whole store on day one and then ascribe any conversion change to BNPL. A clean A/B test on a subset of categories or traffic for six to eight weeks gives you a real number to plan against.
How to run a BNPL conversion test that gives you real data
The right way to evaluate BNPL on your store is a holdout test. The outline below works for most mid-market US e-commerce operations with at least 5,000 monthly orders.
- Pick two comparable categories with similar AOV, similar traffic, and similar conversion. Apparel subcategories or home subcategories work well.
- Enable BNPL on one category with full placement: product page messaging, cart drawer, checkout, and abandonment email.
- Keep the other category clean as the control. No BNPL messaging, no BNPL option.
- Run for six to eight weeks to capture at least two full marketing cycles and one paycheck cycle.
- Measure checkout conversion, AOV, refund rate, and contribution margin on both categories.
- Subtract attributable BNPL revenue from cannibalized payment methods to estimate true incremental revenue.
- Decide based on contribution margin lift, not just headline conversion.
If contribution margin moves up by 2 percent or more after fees, BNPL is paying its way. If it is flat or negative, you are subsidizing the lender without growing the business.
Real examples from US retailers in 2025 and 2026
A few representative patterns, anonymized but drawn from real US retail rollouts, illustrate how the math plays out in practice.
Mid-market apparel brand, $40M revenue. Added Affirm and Pay in 4 on product pages and checkout, kept Apple Pay and card as the primary options. After 90 days, BNPL attach rate stabilized at 16 percent, AOV on BNPL orders ran 42 percent higher than card AOV, and overall checkout conversion lifted by 11 percent. After fees, contribution margin grew 3.5 percent. Clean win.
Home and decor retailer, $120M revenue. Already offered financing through a private-label card. Added Affirm with longer installment terms (up to 24 months) on items over $300. Attach rate on those items hit 22 percent within four months, AOV on BNPL orders ran 60 percent higher than card orders, and the private-label card did not lose share. Net contribution margin grew 4.8 percent. Clear case for layered financing rather than replacing one option with another.
Beauty subscription brand, $20M revenue. Added Klarna and Afterpay on a $35 monthly box. Attach rate sat at 4 percent, AOV barely moved (subscription price was fixed), and refund and dispute volume jumped 20 percent because customers used BNPL to delay payment and then disputed when boxes shipped. Net contribution margin fell 1.2 percent after fees. Removed BNPL after six months.
The takeaway is not that BNPL works or does not work. It is that BNPL works when the basket size, audience, and refund flow match the format.
Tools, partners, and vendors worth knowing in 2026
The US BNPL provider landscape has consolidated since the 2022 to 2024 shakeout. The viable mainstream options for most US e-commerce stores in 2026 are:
- Affirm: Strongest for higher-ticket items, longer terms (3 to 36 months), best for home, electronics, fitness, and travel. Approval rates high for prime credit.
- Klarna: Broad audience, strong UX, good for apparel and beauty. App-based discovery brings additional traffic to integrated retailers.
- Afterpay: Strong Gen Z and millennial penetration, Pay-in-4 only by default. Owned by Block, integrated with Square and Cash App for cross-channel use.
- PayPal Pay in 4: Easiest to enable if you already accept PayPal, low friction, decent attach for under-$500 baskets.
- Zip and Sezzle: Mid-market alternatives with lower merchant fees and slightly lower approval rates. Useful as a secondary option.
For deeper guidance on integration choices and configuration, see adding BNPL to a Shopify or WooCommerce store the smart way and the broader review of tools and vendors for BNPL in 2026. For context on how BNPL providers themselves raise capital and price their offerings, the breakdown of how retail tech funding rounds are structured and read is a useful sidebar.
Whichever provider mix you choose, the most important rule is to keep checkout simple. Two BNPL options at most, clear pricing, and clean refund flow. The retail payments guide covers the broader payment-stack tradeoffs in more depth.
How to read your BNPL dashboard once it is live
Most BNPL providers offer a merchant dashboard with conversion, approval, and AOV metrics. The numbers to watch closely:
- Approval rate by month, by basket size, and by traffic source. A drop below 60 percent signals the provider is tightening risk and your checkout conversion will follow.
- Attach rate by category. Compare to the category benchmarks above. If you are well below, your placement is weak.
- AOV uplift on BNPL orders versus card orders. Should consistently be 25 to 60 percent. If it is under 20, BNPL is not driving incremental basket size.
- Refund rate on BNPL orders versus card orders. A gap of more than 2 points means your refund flow is broken or customers are using BNPL as a return float.
- Dispute and chargeback rate. Should be roughly equal to card. A meaningful gap is a sign of fraud or process problems.
Review these monthly and re-evaluate provider mix every six months. BNPL is not a set-and-forget feature.
How BNPL economics shift with cart size
The conversion conversation usually skips the unit economics piece, which is where many BNPL rollouts quietly bleed margin. The simple rule: BNPL profitability scales with cart size, not just attach rate.
On a $50 cart with a 5 percent BNPL fee, the merchant pays $2.50 to convert a transaction that may have happened on a card anyway at a 1.8 percent fee ($0.90). Net cost of switching: $1.60 of margin per transaction. If incremental conversion is below 4 percent on that segment, the program is dilutive.
On a $300 cart with the same 5 percent BNPL fee, the merchant pays $15. If the BNPL message lifted AOV from $230 to $300 (a 30 percent uplift in a high-impact category), the extra $70 of revenue likely carries $25 to $35 of contribution margin even at modest gross margins, comfortably outpacing the fee. That is why BNPL works for furniture, fitness equipment, and electronics but struggles for low-AOV beauty subscriptions.
Build a simple breakeven model before launch: contribution margin per incremental BNPL order must exceed (BNPL fee minus card fee) plus the value of any cannibalized card volume. Most stores skip this step and discover the gap only in the second quarter of operation.
What the next 12 months will likely bring for US BNPL
Three shifts are worth planning around in 2026 and into 2027. First, regulatory parity with credit cards is now in effect for Pay-in-4 disclosure, dispute rights, and refunds. Merchants should expect dispute volumes that look closer to card chargebacks, which means rebuilding the post-purchase service playbook to match.
Second, BNPL providers are pushing into “BNPL-as-a-feature” embedded inside bank apps (Chase, Citi, Apple Card) and inside checkout platforms (Stripe, Shop Pay). Standalone BNPL buttons matter less; embedded installments matter more. If you accept Apple Pay and Shop Pay, you already offer installments to a meaningful share of shoppers without a third-party contract.
Third, longer-term financing (12 to 36 months at zero or low APR) is winning share over Pay-in-4 for higher-ticket purchases. For categories above $400 average ticket, the relevant question is not “do we offer BNPL” but “do we offer longer-term financing that matches the customer’s mental budget for that purchase.”
The retailers that win the next 12 months will treat BNPL as a layered offer (Pay-in-4, longer installments, and embedded installments via wallet), not a single button bolted to checkout.
FAQ
Does BNPL really lift conversion for every retailer?
No. BNPL lifts conversion meaningfully when baskets are large enough to feel like a real spending decision (typically over $80), the customer base skews toward ages 25 to 44, and the store uses layered placement rather than checkout-only display. Low-AOV stores, grocery, and convenience categories see little to no lift.
What is a good BNPL attach rate?
For US retail in 2026, healthy attach rates run 14 to 17 percent in apparel and home, 8 to 12 percent in electronics and sports, 4 to 6 percent in beauty, and under 3 percent in grocery and convenience. Attach rate under half of category benchmark usually points to weak placement upstream of checkout.
How many BNPL providers should I offer?
Two at most for the majority of retailers. One premium provider (Affirm or Klarna) and one mass-market option (Afterpay, PayPal Pay in 4, Sezzle, or Zip) gives broad coverage without cluttering checkout or creating decision paralysis. Stacking three or more usually reduces conversion.
What does BNPL cost the merchant?
Merchant fees typically range from 2 to 6 percent of order value, with premium providers (Affirm, Klarna) at the higher end and mass-market Pay-in-4 options at the lower end. Fees vary by category, AOV, and contract term. The cheapest provider is rarely the most profitable once approval rate and conversion impact are factored in.
Can BNPL cannibalize my card payments?
Yes, on low-AOV baskets. When BNPL is offered indiscriminately on small orders, many customers simply switch payment method without spending more. This shifts the payment mix and raises fees without growing revenue. The fix is to gate BNPL messaging by basket value, surfacing it only above a category-specific threshold.
How long should I run a BNPL A/B test?
Six to eight weeks for most mid-market stores. That window captures at least two full marketing cycles and one US paycheck cycle, smoothing out short-term promotional noise. Shorter tests often produce misleading results because BNPL adoption ramps gradually as customers learn the option exists.
Does BNPL affect SEO or product listing performance?
Not directly. Search engines do not rank stores based on BNPL availability. Indirectly, BNPL messaging on product pages can lift click-through from comparison shopping engines and improve on-page engagement signals, which can support rankings over time. Treat the SEO upside as a side benefit, not a primary reason to add BNPL.
Is BNPL regulated in the US?
Yes, increasingly. The Consumer Financial Protection Bureau finalized a rule in 2024 treating Pay-in-4 BNPL similarly to credit cards for disclosure, dispute rights, and refund timing. Merchants do not regulate themselves, but they share reputational exposure with providers. Pick a provider with mature compliance and clear refund flows, not the cheapest contract.