
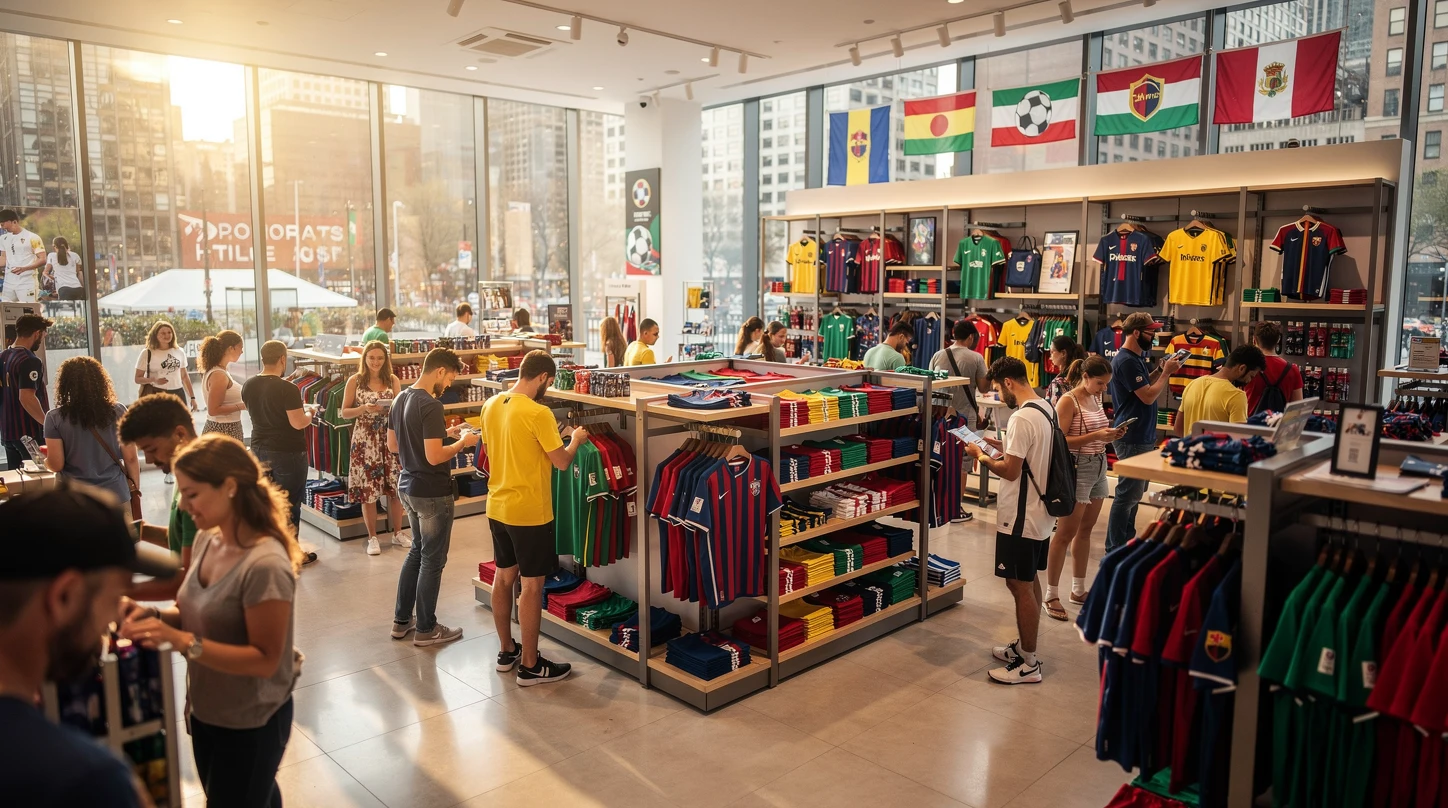
The 2026 FIFA World Cup closed on Sunday after five weeks that turned 11 United States host cities into shopping and dining districts, and the first full read on the retail impact is now in. According to spending data compiled by the Bank of America Institute and reported across the trade press on Monday, the tournament helped push US consumer card spending to its strongest monthly growth in more than four years during June, with host cities capturing an outsized share of the gains.
The picture that emerges is not a uniform national windfall. It is a concentrated one, tilted heavily toward the stadium cities, their restaurants and bars, and the international visitors who flew in for the matches. Retailers that planned for the surge, from Target to Chipotle to a string of local operators, booked their best days of the year. Those outside the host markets saw little more than a normal summer.
In short
- Best month in years: US consumer card spending rose 6.3% year over year in June, the strongest growth in more than four years, with the World Cup cited as a key driver.
- Host cities won: Spending across host cities climbed 5.4% over the group stage, and restaurant spending in those cities ran roughly 2 percentage points above the rest of the country.
- Non-locals drove it: Spending by visitors from outside host cities jumped 17.4%, and international customers accounted for about 17% of the host-city increase.
- Merch concentrated: Target sold roughly 66% of its World Cup merchandise in the 11 host cities, which make up only about a quarter of its stores.
- Uneven tail: Outside the host markets, non-restaurant retail growth actually slowed once matches began, leaving the boost narrowly distributed.
Why the World Cup was a retail event, not just a sporting one
The 2026 tournament was the largest in the competition’s history, expanding to 48 teams and 104 matches spread across the United States, Canada and Mexico. Sixteen cities hosted games, 11 of them in the US, from Los Angeles and the New York and New Jersey metro area to Dallas, Miami, Atlanta, Seattle, Kansas City, Boston, Houston, Philadelphia and the San Francisco Bay Area. That footprint put stadiums inside or beside some of the country’s densest consumer markets.
Unlike a domestic league season, a World Cup concentrates demand into a fixed window and a defined set of places. Fans travel, stay for days, and spend on food, drink, lodging, transport and merchandise while they are in town. For retailers and restaurants near the venues and fan festivals, that is a predictable, plannable spike rather than a diffuse lift.
The result was a summer in which host cities behaved differently from the rest of the country. Bank of America economist Joe Wadford summarized the effect bluntly, saying the tournament “created a tailwind for the economy” and that host cities “saw a significant increase in brick and mortar spending, especially compared to the rest of the US.” That divergence, more than any single national number, is the story the data tells.
It also arrived at a useful moment for a consumer economy that spent much of the year under pressure from tariffs and cautious budgets. The spending strength echoed a broader mood shift captured in US consumer sentiment rebounding to a five-month high as gas prices eased, giving households a little more room to celebrate.
What the spending data actually shows
The headline figures come from Bank of America’s aggregated credit and debit card data, which the bank breaks down by the metro areas tied to tournament stadiums. Taken together, they describe a broad national uptick layered on top of a sharp, localized surge in the host markets.
Card spending hit a four-year high
Total US card spending per household rose 6.3% year over year in June, which Bank of America described as the strongest growth in more than four years. Stripping out gasoline, the gain was 5.6%. Wadford said the improvement built “toward the end of the month,” which lines up with the tournament’s opening on June 11 and its group stage running through late June.
That timing matters for interpretation. A spending acceleration that clusters in the back half of June, precisely as matches filled stadiums, is consistent with a World Cup effect rather than a generic seasonal bump. The bank was careful to frame the tournament as a contributor rather than the sole cause, but it named the event repeatedly as a driver.
Host cities pulled away from everywhere else
Across the full group stage, from June 10 to June 28, total spending in host cities rose 5.4% year over year, with transactions up about 3%. Restaurant spending in those cities ran roughly 2 percentage points higher than in the rest of the country, where restaurant spending was closer to flat. Non-restaurant retailers in host cities gained ground after the tournament began, while similar retailers elsewhere saw growth slow.
The gap between the two groups is the clearest signal in the dataset. It is not that the whole country spent more because a tournament was happening somewhere; it is that the cities hosting matches pulled measurably ahead of those that were not. For retail strategists, that concentration is the actionable insight.
Non-locals did the heavy lifting
The most striking split is between local and visiting spend. Bank of America found that local spending in host cities rose about 2.7% over the group stage, while spending by non-locals jumped 17.4%, with non-local transactions up roughly 10%. In other words, residents spent a little more, but the real surge came from people traveling in for the matches.
Institute economists Liz Everett Krisberg and David Tinsley wrote that host cities delivered “a strong performance, with spending up 5.4% year over year over the full group stage,” and that the boost was “particularly driven by non-locals coming into the cities for the matches.” That dynamic reframes the event for retailers: the incremental customer was often a tourist with a short window and a full wallet, not a regular.
Who cashed in: the retailers and categories that scored
The benefit was not spread evenly across the retail floor. It flowed toward businesses positioned near venues and fan zones, toward food and drink, and toward anyone selling tournament merchandise. Several operators reported their best trading days of the year.
Target and official merchandise
Target leaned into the tournament as an official retail partner, and the payoff was geographically lopsided. The retailer sold roughly 66% of its FIFA World Cup 2026 merchandise in the 11 host cities, even though those markets account for only about a quarter of its store base. Host-city stores moved about 2.4 times more product than stores in non-host markets, according to figures the company shared with the trade press.
Target also saw where the international money landed. It reported that Los Angeles logged the most transactions from international shoppers, followed by the New York and New Jersey area, Dallas, San Francisco and Miami. That ranking is effectively a map of where visiting fans concentrated their spending. The scale of the merchandise pull helps explain why the chain has been aggressive on physical expansion, including opening 11 large new stores this month.
Restaurants, bars and quick service
Food and drink were the clearest winners. Restaurant spending in host cities outpaced the rest of the country by about 2 percentage points, and quick-service chains turned match days into promotional events. Chipotle ran a buy-one-get-one offer tied to the tournament that produced its single biggest store-traffic day of 2026, the company said.
The pattern fits how fans consume a tournament. Matches pull crowds into bars, restaurants and viewing areas for hours at a time, often across multiple games a day during the group stage. For operators near stadiums and fan festivals, that translated into repeat visits over a compressed five-week run.
Experiential retail and pop-ups
Brands also treated the tournament as a stage. Waffle House opened a merchandise pop-up near the FIFA Fan Festival in Atlanta, converting a cultural moment into a temporary retail location. That kind of activation, a brand renting attention in a high-traffic zone for a limited window, is exactly the experiential playbook that has been reshaping physical retail.
The tactic reflects a broader shift toward stores as destinations and events rather than pure distribution points. It sits alongside the wider move in physical retail toward experience-led formats, a theme running through much of the sector’s 2026 store strategy.
Adjacent and unexpected beneficiaries
The lift reached categories well beyond apparel and food. Standard Wellness, a cannabis operator, reported foot traffic up 5% to 12% at its Kansas City dispensary between June 11 and July 16, tracking the tournament window. Walmart also flagged early sales increases tied to the event, though it did not break out detailed figures.
These spillovers underline how a mega-event redistributes discretionary spending across a host city rather than confining it to official partners. When hundreds of thousands of visitors arrive, the money spreads to convenience, wellness, transport and local services that have nothing to do with soccer.
The international-visitor effect
The single most valuable customer segment was the overseas fan. International customers accounted for about 17% of the increase in host-city spending, a share large enough to move the aggregate numbers on its own. Sara Walsh of Bank of America put it directly, saying “17% of the increase in spend has come from international customers visiting our host cities.”
That inbound spending is why the tournament read as a tourism story as much as a retail one. Pre-tournament projections had estimated the event could generate close to $9.1 billion in North American GDP across June and July, including roughly $8 billion in tourism-related spending, with something on the order of $1.47 billion flowing specifically to US wholesale and retail. Broader consumer-spending estimates ran as high as $7.5 billion.
Those projections should be read as directional rather than precise, and the final tally will take time to confirm. But the card data is consistent with their thrust: a large share of the retail benefit came from money that would not otherwise have entered these cities. For host markets, the World Cup functioned as a compressed, high-spend tourism season layered onto early summer.
Host city league table: where the money landed
The gains were not uniform even among host cities. Bank of America’s breakdown showed the strongest lifts in markets where the United States men’s team played and drew home crowds, and where fan festivals concentrated foot traffic. The table below summarizes the host-city spending signals disclosed so far.
| Host market | Spending signal | Notable detail |
|---|---|---|
| Los Angeles | +6.8% group-stage spending | Most international transactions of any host city |
| Seattle | +5.0% group-stage spending | Hosted USA group-stage matches |
| Boston | Over 6% July spending growth | Among the strongest July follow-through |
| Kansas City | Over 2% July spending growth | Cannabis foot traffic up 5% to 12% |
| New York / New Jersey | High international volume | Second for international transactions; hosted the final |
| Dallas | High international volume | Third for international transactions |
| Miami | Elevated visitor spend | Fifth for international transactions |
The July figures are important because they show how quickly the effect faded once the group stage ended and teams were eliminated. Cities still hosting knockout matches, and those with strong fan festivals, held their momentum better than markets whose tournament ended early.
How this compares with past mega-events
A concentrated, tourism-led retail bump is a recognizable pattern from previous mega-events, but the 2026 tournament’s scale and multi-city footprint make it unusual. The comparison below frames the World Cup’s retail signature against the kinds of events retailers plan around, based on the disclosed data and standard industry characterizations.
| Event type | Spending pattern | Duration | Retail winners |
|---|---|---|---|
| 2026 World Cup (US host cities) | Host-city surge, non-local led, +5.4% group stage | Roughly five weeks | QSR, official merch, experiential pop-ups |
| Single-city championship game | Sharp one-day spike, localized | One to a few days | Bars, apparel, ticketed hospitality |
| Prime Day and promotional events | National online surge, discount-driven | Two to four days | Marketplaces, electronics, DTC brands |
| US holiday peak season | Sustained national lift, gift-driven | Roughly eight weeks | Broad retail, especially discretionary |
The contrast with promotional events is instructive. A Prime Day style event drives national, online, discount-led demand, whereas the World Cup drove local, in-person, full-price spending centered on food, drink and experience. For retailers, the two require almost opposite playbooks, one built on inventory and fulfillment, the other on physical presence and staffing near venues.
Looking ahead, the calendar itself is compressing. The tournament’s summer pull is one reason forecasters expect the earliest US holiday season on record, as retailers try to capture wallets before budgets tighten again in the fall.
The uneven tail: who did not get a bump
For all the strong headline numbers, the data is equally a story about who missed out. Outside the host cities, non-restaurant retail growth actually slowed after the tournament began, suggesting that some discretionary spending was pulled toward host markets rather than created nationally. A dollar spent by a traveling fan in Los Angeles is, in part, a dollar not spent at home.
Higher-income households also eased their spending slightly even as lower-income households increased theirs in host-city brick-and-mortar businesses, a reversal of the usual pattern. Bank of America noted that all income groups lifted restaurant spending once matches began, but the retail boost skewed toward lower-income and younger consumers celebrating a generational event.
That distribution has implications for how retailers read the quarter. National chains without a host-city concentration should not expect the tournament to flatter their comparable sales, and any June strength in the aggregate figures may overstate the underlying trend once the event rolls off. The lift was real, but it was borrowed against geography and time.
It also complicates demand planning for logistics networks that had to serve concentrated, short-lived spikes in specific metros. Retailers leaning on fast fulfillment to capture in-the-moment demand, a capability underscored by moves like Amazon switching on 30-minute delivery for millions, had an edge in host markets where impulse spending clustered.
The consumer backdrop behind the numbers
The World Cup landed on a US consumer that had spent much of 2026 in a defensive crouch. Tariff-driven price increases, softer budgets and a general trade-down toward value had kept discretionary spending muted through the spring. Against that backdrop, a 6.3% June jump reads as a genuine break in the trend rather than a continuation of it.
That context is why economists were quick to attribute the strength to the tournament rather than a broad recovery. The gains were concentrated in exactly the categories a soccer tournament would flatter, restaurants, bars and host-city foot traffic, and they built through the month rather than starting strong. A durable consumer rebound would look different, spread more evenly across categories and geographies.
The income split reinforces the point. Lower-income and younger households, the groups most likely to have pulled back earlier in the year, drove much of the host-city brick-and-mortar increase, while higher-income households eased slightly. That pattern suggests the event unlocked celebration spending from budget-conscious consumers, a one-time release rather than a structural shift in confidence.
For retailers reading their own numbers, the lesson is to separate signal from noise. June strength in a host market is not evidence that the underlying consumer has turned; it is evidence that a rare event pulled spending forward. The task now is to judge how much of that demand was borrowed and how much was truly new.
How retailers turned matches into trading events
The retailers that outperformed did not simply happen to sit in host cities. They treated the tournament as a merchandising and operations problem to be solved in advance, from inventory placement to staffing to promotions timed around match schedules. The gap between winners and also-rans was largely a gap in preparation.
Inventory placed where the crowds would be
Target’s decision to weight World Cup merchandise toward the 11 host cities was the clearest example of geographic inventory planning. By concentrating stock where visiting fans would shop, the chain captured 66% of its tournament merchandise sales from about a quarter of its stores. That is a deliberate allocation, not an accident of demand.
The alternative, spreading merchandise evenly across a national footprint, would have stranded stock in markets with no tournament traffic while risking stockouts in the cities that mattered. For seasonal and event-driven products, placement is as important as volume, and the host-city concentration shows how sharply that principle applied here.
Promotions timed to the tournament rhythm
Quick-service chains used limited-time offers to convert match-day crowds into traffic. Chipotle’s buy-one-get-one promotion, tied to the tournament, produced its biggest store-traffic day of the year, a result that reflects timing as much as discount depth. Offers landed when fans were already out and primed to spend.
The tournament’s group-stage schedule, with multiple matches a day over consecutive weeks, gave operators repeated windows to activate. That cadence rewarded brands that planned a run of promotions rather than a single push, keeping their offer in front of fans across the five-week event.
Presence in the fan zones
Some brands went further and built temporary retail where the crowds gathered. Waffle House’s merchandise pop-up near the Atlanta fan festival is a template for event retail, meeting customers in a high-traffic zone rather than waiting for them to visit a store. The pop-up format let brands participate in the cultural moment without a permanent footprint.
These activations also generated attention beyond the immediate sales. A branded presence in a fan zone doubles as marketing, earning social visibility and association with the event that outlasts the tournament itself. For challenger and regional brands, that exposure can be worth as much as the transactions.
What it means for the second half of 2026
The immediate question for retailers is whether the World Cup pulled spending forward or added to it. The evidence points to a mix. Genuinely incremental demand came from international visitors and tourism, but some domestic spending appears to have been redistributed across geographies and, potentially, across time.
That matters because the back half of 2026 is unusually front-loaded. With the tournament boosting early summer and forecasters pointing to an earlier holiday ramp, the middle of the year could see softer comparisons as the event fades. Retailers that booked strong host-city numbers in June and July will face tougher year-over-year hurdles in those same markets next summer.
The strategic takeaway is that mega-events reward preparation and presence over scale. The winners were not simply the biggest retailers; they were the ones with the right stores in the right cities, the right merchandise ready, and the operational flexibility to turn a match day into a trading event. As the calendar tightens toward the holidays, the same logic applies, which is one reason analysts expect the 2026 holiday peak to flatten away from Black Friday as retailers spread demand across a longer, earlier window.
For now, the tournament leaves the US consumer economy with a rare bright spot in a cautious year, and a reminder that place still matters in retail. The detailed methodology and figures behind the spending analysis are published by the Bank of America Institute. The next test is whether host cities can hold any of that momentum now that the final whistle has blown.
Frequently asked questions
How much did US consumer spending rise during the World Cup?
US consumer card spending per household rose 6.3% year over year in June 2026, which Bank of America described as the strongest growth in more than four years. Excluding gasoline, spending was up 5.6%. The bank cited the World Cup as a key driver, particularly in the back half of the month.
Which host cities benefited the most?
Los Angeles saw group-stage spending up about 6.8% and logged the most international transactions, while Seattle rose about 5.0%. Boston posted the strongest July follow-through at over 6%. The New York and New Jersey area, Dallas and Miami also drew high volumes of international spending.
Why did non-local spending matter so much?
Spending by visitors from outside host cities jumped 17.4% during the group stage, compared with a 2.7% rise in local spending. International customers alone accounted for about 17% of the host-city increase, making traveling and overseas fans the most valuable customer segment of the tournament.
Which retailers and categories cashed in?
Target sold about 66% of its World Cup merchandise in the 11 host cities and moved 2.4 times more product there than elsewhere. Restaurants and quick-service chains such as Chipotle saw record traffic days, and even adjacent categories like cannabis retail reported foot-traffic gains of 5% to 12%.
Did the whole country benefit or just the host cities?
The benefit was concentrated in host cities. Outside those markets, non-restaurant retail growth actually slowed after matches began, suggesting some spending was redistributed toward host cities rather than created nationally. The tournament lifted the aggregate June figures, but the underlying boost was narrowly distributed.
How does the World Cup compare with events like Prime Day?
The two drove almost opposite patterns. Prime Day style events generate national, online, discount-led demand over a few days, while the World Cup drove local, in-person, full-price spending on food, drink and experiences over roughly five weeks. Each rewards a different retail playbook.
How big was the overall economic impact?
Pre-tournament projections estimated the event could add close to $9.1 billion to North American GDP across June and July, including about $8 billion in tourism-related spending and roughly $1.47 billion for US wholesale and retail. Broader consumer-spending estimates ran as high as $7.5 billion, though final figures will take time to confirm.
Will the spending boost last into the second half of 2026?
Probably not at the same pace. The lift came partly from incremental tourism and partly from spending pulled forward or redistributed, so host cities are likely to face softer year-over-year comparisons as the event fades. Retailers now turn to an unusually early holiday season to sustain momentum.
What should retailers take away from the tournament?
The winners were retailers with the right stores in the right cities, merchandise ready in advance, and the operational flexibility to turn match days into trading events. Mega-events reward preparation and physical presence over sheer scale, a lesson that carries into holiday planning.