
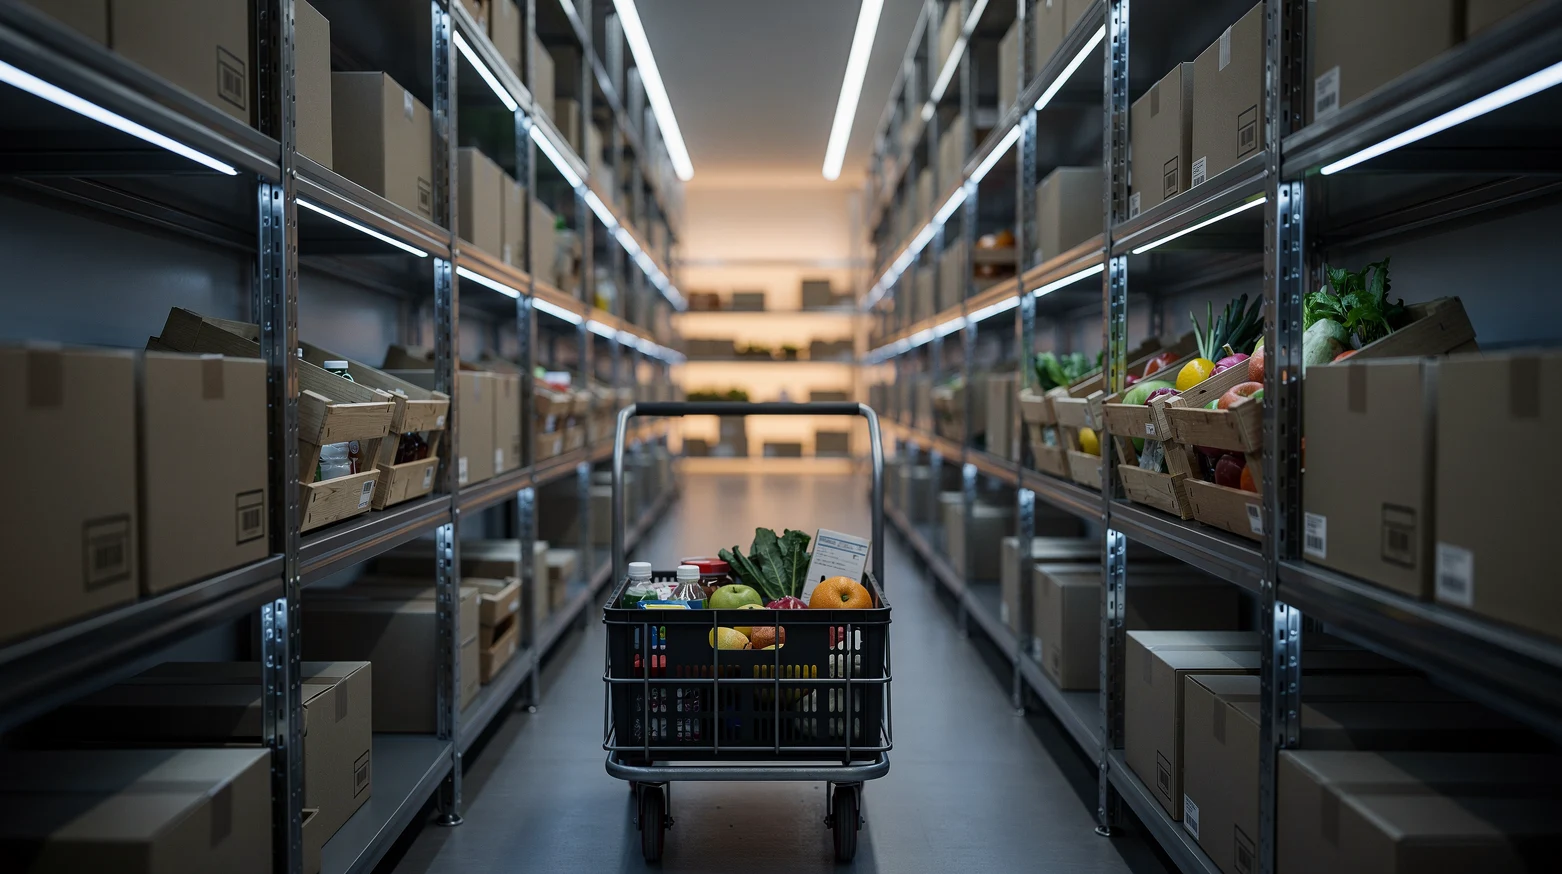
A rapid delivery range is a fraction of a supermarket, and that is the point. A typical suburban grocery store carries somewhere between 30,000 and 40,000 items; a dark store built for 15-minute delivery usually holds 1,500 to 4,000. Quick commerce assortment is the discipline of deciding which of those few thousand lines earn a slot, which missions they serve, and what gets cut when the monthly numbers come in.
Operators who get it right run tight ranges that still feel complete to the customer. Operators who get it wrong either bloat the store until picking slows down, or trim it until the basket falls apart and the customer goes back to the big-box app.
In short
- Range size is an operational constraint, not a merchandising choice. Every extra SKU adds pick time, shelf space, waste risk and working capital inside a store that has to hit a 10 to 20 minute promise.
- The core list comes from basket data. The question is not “which categories should we cover” but “which items sit in the baskets that repeat”, measured by velocity, attachment rate and basket-completion rate.
- Missions decide the shape of the range. Top-up, impulse, emergency and occasion baskets each need a specific cluster of items, and a range that covers missions beats one that covers categories.
- Fresh, chilled and frozen are the hardest lines to carry in a small footprint: they drive frequency but they also drive waste, so they are ranged narrow and turned fast.
- Substitution policy and the monthly range review are where assortment is actually managed. A missing item that is handled well costs a few cents; a missing item that is handled badly costs the customer.
Why do quick commerce ranges stay deliberately small?
The range is small because the store is small, the picker is walking, and the clock is running. A quick commerce operation typically works out of a dark store of 2,000 to 10,000 square feet, staffed by pickers who have to assemble an order in two to four minutes so that a rider can be out of the door inside five. Every additional SKU makes the pick path longer, the shelf labels denser and the probability of a mis-pick higher. That is why operators such as Gopuff have historically described their micro-fulfillment ranges in the low thousands of items rather than the tens of thousands a supermarket carries.
The second constraint is capital. A 3,000-line store holding two weeks of cover on every item is carrying inventory that a 30,000-line supermarket can spread across far more revenue. In the first wave of European rapid grocery, companies including Gorillas, Getir, Zapp and Weezy learned this the expensive way: ranges grew to satisfy demand signals, cover ran long on slow lines, and fresh write-offs became a structural drag. Getir’s 2024 retreat from the UK, Europe and the US had many causes, but investors repeatedly flagged unit economics, and range discipline sits right underneath them.
The third constraint is the customer’s own expectation. Nobody opens a rapid delivery app to do a weekly shop. They open it because they have run out of milk, they have friends arriving in an hour, or they want ice cream at 10pm. A range that covers those moments completely will feel bigger than it is; a range that covers every category thinly will feel small even at 5,000 lines.
The economics of rapid delivery, from rider density to basket size, are covered in depth in our guide to how quick commerce works; this article stays on the shelf.
Why bigger ranges crept back in India
India’s quick commerce leaders have pushed the other way. Blinkit, Zepto and Swiggy Instamart have opened larger dark stores and reported ranges in the tens of thousands of items in some locations, including electronics, toys and apparel. The logic there is different: labor cost per pick is lower, order density in major cities is extreme, and the platforms are competing to become the household’s default app rather than its emergency top-up. That model relies on cheap picking labor and dense cities, and it is not a template for a Western grocer running a 15-minute promise from a converted retail unit.
How do you build the core list from basket data rather than category habit?
The core list is the set of items that show up in baskets that repeat, and it is built from transaction data rather than from a supermarket category tree. A conventional grocer ranges by category depth: so many pasta shapes, so many sauces, so many yogurts. A rapid delivery operator has no room for depth, so the question shifts from “how many pasta shapes” to “which two pasta shapes appear in the most baskets, and what else is in those baskets”. The retail industry’s shift toward mission-led rather than category-led ranging is one of the themes in our look at how supermarket strategy is shifting in 2026, and quick commerce is where that shift is most extreme.
Start with velocity, but do not stop there
Velocity (units sold per store per day) is the obvious first filter. Sort every SKU by velocity, draw a line at the number of slots you have, and you get a first draft. The problem is that pure velocity over-ranges the head and under-ranges the items that make baskets complete.
Bananas, milk, eggs and bottled water will always top a velocity ranking. They are essential, but they do not need eight facings each, and a range built only on velocity ends up with 40 drinks and no baking powder.
Add attachment rate
Attachment rate measures how often an item appears alongside another item in the same basket. It is the single most useful metric for a small range because it shows which low-velocity items are quietly holding baskets together. Lime, mint and tonic each sell modestly on their own; together with a bottle of gin they define an occasion basket that is worth four times the average order value. Drop the mint and the basket may not happen at all, because the customer will go where the whole mission can be completed.
Measure basket-completion rate
The most important number in quick commerce assortment is the share of started baskets that end in a completed order. If a customer adds six items and then abandons, the search log will usually show what they could not find. Operators who track “searched, not found” terms alongside abandonment can see the missing SKUs directly. A range that lifts completion from 70 percent to 78 percent has done more for revenue than any amount of added depth in snacks.
The Pareto trap
The Pareto principle is usually invoked to justify cutting the tail: 20 percent of items generate 80 percent of sales, so cut the other 80 percent. In a rapid delivery range the tail cannot simply be cut, because the tail is where basket completion lives. The right move is to cut the tail items that appear alone and keep the tail items that appear with the head: a bottle of vanilla extract that sells twice a week but appears in 90 percent of baking baskets is a keeper, while a craft soda that sells four times a week but never with anything else is a candidate for delisting.
| Metric | What it tells you | How it shapes the range | Typical threshold used |
|---|---|---|---|
| Velocity (units per store per day) | Raw demand for the item | Sets facings and cover; identifies obvious head items | Bottom 10 to 15 percent reviewed monthly |
| Attachment rate | How often the item appears with other items | Protects low-velocity items that complete missions | Above 30 percent co-occurrence with a head item usually protects the line |
| Basket-completion rate | Share of started baskets that check out | Reveals gaps via “searched, not found” data | Target above 75 percent; gaps triaged weekly |
| Waste rate | Units written off as a share of units received | Caps how many fresh and chilled lines the store can carry | Above 8 to 10 percent triggers a cover or delist decision |
| Substitution acceptance | Share of offered substitutes accepted by customers | Shows which lines can be thinned because a substitute works | Above 60 percent acceptance means the pair can share a slot |
| Contribution after pick cost | Margin minus the time cost of picking the item | Penalizes bulky, awkward or low-margin lines | Negative contribution after two review cycles triggers delisting |
The table is deliberately generic; each operator sets its own thresholds. The principle is that no single metric decides a SKU’s fate, and that basket-level data beats item-level data at every step.
Which impulse and top-up missions repeat, and what do they need on the shelf?
A rapid delivery range is really a set of overlapping mission kits, and each mission has a predictable core. Operators that map their orders to missions find that a handful of them account for the large majority of baskets: the evening top-up, the breakfast rescue, the snack and treat run, the hosting kit, the household emergency and the pharmacy-adjacent basket. Ranging by mission means asking, for each one, “what is the minimum set of items that lets a customer finish this mission without opening another app”. Missing one item from a mission kit hurts far more than missing an entire unrelated category.
The evening top-up
This is the bread-and-butter order: milk, bread, eggs, a vegetable or two, something for dinner, something for tomorrow’s lunch. It is the mission that most resembles a convenience store trip and it repeats several times a week for a loyal customer. The range for this mission should be boring and complete: one or two of each staple, a rotating set of six to ten dinner solutions, and enough fresh produce to cover the ten most common vegetables. Depth is unnecessary; presence is everything.
The snack and treat run
Ice cream, chips, chocolate, soft drinks and beer or wine where licensing allows. This mission is high margin, evening-weighted and brand-sensitive: customers want the exact ice cream they saw in an ad, not a private-label equivalent. It is the one part of the range where a little depth in the head brands pays off, because a customer who cannot find their brand will not substitute, they will close the app. Operators often let this mission run to 200 to 300 lines even in a 2,000-line store.
The hosting kit
Friends are arriving; the customer needs ice, mixers, snacks, a lemon, napkins and something to drink. Basket value is high and tolerance for a missing item is low, so this mission justifies items that look inefficient on velocity alone: bagged ice, cocktail garnishes, a short run of premium spirits and party-sized packs. Attachment data will justify them; velocity data never will.
The household emergency
Toilet paper, diapers, batteries, phone chargers, painkillers, pet food, light bulbs. Each sells slowly and each creates a fiercely loyal customer when it arrives in 15 minutes at 11pm. Operators tend to under-range this mission because individual velocities look poor; the correct measure is customer retention after an emergency order, and it is usually excellent.
The impulse layer
On top of the missions sits an impulse layer: the new snack, the seasonal item, the limited edition drink. These lines have no history to justify them and they give the app a reason to be opened. The discipline is to cap the layer at 5 to 10 percent of slots, rotate it monthly, and judge each item on attachment to existing missions rather than solo velocity.
How do fresh, chilled and frozen work in a small footprint?
Fresh, chilled and frozen are the categories that make a rapid delivery service feel like a grocer rather than a vending machine, and they are also the categories that generate most of the waste. A dark store with limited refrigeration and no back room has to range these categories narrowly, turn them fast and tolerate some out-of-stocks late in the day. The operating detail of how chilled space, pick paths and staffing come together is the subject of our companion piece on dark store operations; here the question is what to put in that chilled space.
Produce: the ten-vegetable rule
Most operators find that a short list of produce lines covers the overwhelming majority of produce demand: bananas, apples, lemons and limes, tomatoes, onions, potatoes, avocados, salad leaves, cucumbers, peppers and a small rotating set of seasonal items. Going beyond that list adds waste faster than it adds sales. The exceptions are city-specific: a store serving a neighborhood with a large South Asian population will need coriander, chilies and ginger as core lines, not as a seasonal experiment.
Chilled: dairy first, then meal solutions
Milk, butter, eggs, yogurt and cheese are the chilled core, and they have the advantage of reasonable shelf life. Fresh meat and fish are a different story: high value, short life, hard to substitute and slow on velocity in a rapid channel. Many operators carry a very short range of chilled proteins (chicken breast, mince, bacon, a couple of ready-to-cook options) and rely on a rotating set of chilled ready meals for the dinner mission. The ready-meal range is where a small store can look surprisingly complete, because a dozen well-chosen meals cover most weeknight needs.
Frozen: the quiet winner
Frozen is the category that behaves best in a small footprint: shelf life is long, waste is near zero, and several of the highest-margin impulse items (ice cream, frozen pizza, frozen snacks) live there. The constraint is freezer capacity and the last-mile cold chain, because ice cream that arrives soft generates a refund. Operators that solve the cold chain often extend frozen depth while they cut chilled.
Across all three bands, waste is managed through cover rather than range: a single day’s cover on short-life lines, occasional evening out-of-stocks and dynamic in-app markdowns on items near their date. Fresh waste above roughly 8 to 10 percent of receipts is the usual signal that cover is too long or the line does not belong.
| Temperature band | Share of a 2,000-line range (typical) | Waste risk | Ranging approach | Cover held |
|---|---|---|---|---|
| Ambient grocery | 50 to 60 percent | Low | Mission-led core plus rotating impulse layer | 5 to 14 days |
| Produce | 5 to 8 percent | High | Short fixed list plus seasonal rotation | 1 to 2 days |
| Chilled dairy and eggs | 8 to 10 percent | Medium | Full core, minimal depth | 2 to 4 days |
| Chilled protein and ready meals | 5 to 8 percent | High | Very short protein list, rotating meal solutions | 1 to 2 days |
| Frozen | 8 to 12 percent | Very low | Deep in ice cream and pizza, broad elsewhere | 7 to 21 days |
| Household, health and pet | 10 to 15 percent | Very low | Emergency-led: one or two of everything | 14 to 30 days |
Percentages vary by market, by format and by the operator’s license position (alcohol alone can shift the mix by several points). The pattern that holds across operators is that temperature-controlled categories take a small share of slots and a large share of management attention.
What happens when an item is out, and how should substitutions be handled?
Out-of-stocks are inevitable in a store with one day’s cover on fresh lines, so substitution policy is part of assortment design rather than an afterthought. A well-handled missing item costs the operator a few cents in margin and keeps the customer. A badly handled one (a random swap, a silent removal, a surprise at the door) is one of the most common reasons customers cite for abandoning a rapid delivery app. The point of the exercise is to make the range feel complete even when the shelf is not.
Design substitution pairs at ranging time
The best operators decide a SKU’s substitute when they add it to the range, not when it goes out of stock. Every core line gets a designated substitute (semi-skimmed for whole milk, a second brand of the same chip flavor, a like-for-like private label), and the substitute has to be in the range. That constraint is itself a ranging tool: if an item has no acceptable substitute in the range, either the range needs a second option or the item needs to be held at higher cover. Substitution acceptance data then feeds back into the range: pairs with high acceptance can share a slot, pairs with low acceptance cannot.
Ask before you swap
Customers accept substitutes far more often when they have chosen the rule in advance. In-app settings that let the customer pick “substitute with similar”, “call me” or “refund only” reduce complaints and raise acceptance, and the choices reveal which items customers refuse to see substituted, which are the items that need the deepest cover. Tesco’s Whoosh service, which our coverage of its free delivery promotion looked at, leans on the parent grocer’s substitution logic and private-label depth for exactly this reason.
Hide, do not disappoint
Showing an item as available and then removing it at pick time is worse than not showing it at all. Operators that sync shelf counts to the app every few minutes and suppress items below a safety threshold see fewer refunds and higher completion, and most accept that a fast mover may vanish from the app before the last unit sells.
Every out-of-stock event is also a ranging signal. Items whose absence cancels a basket are more important than their velocity suggests; items whose absence nobody notices are candidates for the next delisting round.
What does the monthly range review look like, and what triggers a delisting?
The monthly range review is where the assortment is actually managed, and it works as a two-sided list: candidates to add and candidates to delist, scored against fixed triggers. Operators that skip it, or run it as a one-way process that only adds, end up with the 5,000-line store that was supposed to hold 2,000. It is also the moment to reconcile the data with what pickers see on the floor.
Delisting triggers
A delisting is rarely triggered by a single metric. The usual pattern is a combination: velocity in the bottom decile for two consecutive months, attachment rate below the protection threshold, no role in a defined mission kit, and a substitute already in the range with acceptable acceptance. Fresh and chilled lines carry an additional trigger: waste above the operator’s ceiling for two cycles. Items on a supplier promotion, seasonal lines and new launches are usually protected from delisting for their first two or three cycles so that they get a fair reading.
Listing triggers
Candidates to add come from “searched, not found” logs, abandoned-basket analysis, competitor range checks and supplier innovation. The strongest signal is a search term that repeats with no matching item; the weakest is supplier enthusiasm. New lines usually enter on trial in the impulse layer, with a review date and a slot they will displace if they succeed.
The review as a numbers meeting
A well-run review produces a short list of changes: typically 3 to 5 percent of the range in and out each month, or 60 to 100 lines in a 2,000-line store. Churn much above that destabilizes pick paths; churn much below it means the range is drifting away from demand. The review should also maintain a list of items protected from delisting and the reason for each, so that protection does not become permanent by neglect.
A scorecard that fits on one page
- Pull velocity, attachment, waste and substitution acceptance for every SKU over the last two cycles.
- Flag every line in the bottom decile on velocity and check it against mission membership and attachment rate.
- Flag every fresh and chilled line above the waste ceiling and decide between shorter cover and delisting.
- Pull the top 50 “searched, not found” terms and match them to candidate SKUs.
- Score candidates on projected attachment, slot cost and supplier terms; rank them.
- Confirm the in-and-out list with the store team, update the planogram and the substitution pairs, and set the review date for each new line.
When is one list per city (or per store) worth it?
Local variation is worth the complexity when the demand difference is large enough to move basket completion, and not before. A single national range is easier to buy, replenish and pick, and for the core staples it is almost always right. But neighborhoods differ sharply in what they cook, drink and need at 11pm, so most operators land on a layered range: a fixed national core, a regional layer and a small local layer.
The layered model
The national core (roughly 60 to 70 percent of slots) is identical everywhere and carries the staples, the head brands and the household emergency kit. The regional layer (20 to 30 percent) reflects broad differences: climate, which sports are on, which chains dominate the local grocery market, and whether the city skews young renters or families. The local layer (5 to 15 percent) is where a store serving a university district ranges energy drinks and instant noodles, and a store serving a family suburb ranges baby food and school snacks. That local layer is the only part of the range where store managers should have real discretion.
What the data says about where it pays
Local variation pays most in produce, ethnic and world foods, alcohol, and the impulse layer. It pays least in ambient grocery and household, where national brands dominate and demand barely varies. The discount grocers offer a useful reference: Aldi and Lidl run extremely tight ranges with limited local variation and still deliver high completion for a weekly shop, a model we unpack in our look at the Aldi and Lidl playbook. Quick commerce operators can borrow their discipline on the core and spend their flexibility on the local layer.
The cost of getting local wrong
Every local SKU has to be bought, replenished and forecast at a smaller scale, so local variation costs more per unit than the national core. Operators that let local ranges grow without a cap end up with hundreds of stores each holding lines that no other store holds, and central buying loses its leverage. In the US, where Kroger and Walmart already run some of the most sophisticated store-level ranging in grocery, rapid delivery operators are competing with incumbents who have decades of local demand data, which raises the bar for anyone trying to out-localize them.
What are the most common quick commerce assortment mistakes?
The same errors show up across operators and markets, and most are the natural result of applying supermarket instincts to a dark store.
- Ranging by category tree. Copying a supermarket’s category structure at one-tenth the depth produces a range that covers everything thinly and completes nothing. Range by mission instead.
- Letting velocity decide alone. Pure velocity rankings kill the low-volume items that hold baskets together. Attachment rate and basket completion have to sit alongside velocity.
- Running a one-way review. Adding without delisting is how a 2,000-line store becomes a 5,000-line store with slower picks and more waste.
- Over-ranging chilled protein. Fresh meat and fish look like signs of a “real” grocer and generate the worst waste in the store. Keep the list short and the cover shorter.
- No designated substitutes. If the substitute is decided at pick time by a picker in a hurry, it will be wrong often enough to lose customers.
- Uncapped local layers. Local variation without a cap destroys buying leverage and forecast accuracy.
Seen against the broader picture in our state of retail overview, these mistakes are the rapid-delivery version of a familiar retail lesson: the operators that survive are the ones that manage the range as a cost as well as a revenue line.
FAQ: quick commerce assortment questions
How many SKUs does a typical quick commerce dark store carry?
Most Western rapid delivery operators carry between 1,500 and 4,000 lines per store, with the range set by store size, pick-time targets and refrigeration capacity. Indian operators such as Blinkit and Zepto have reported far larger ranges in some locations, but those rely on cheap picking labor and extremely dense cities and are not a model for a 15-minute promise elsewhere.
What is the difference between ranging by category and ranging by mission?
Ranging by category starts from a supermarket-style tree (dairy, snacks, household) and asks how deep each branch should go. Ranging by mission starts from the reason the customer opened the app (top-up, hosting, emergency, treat) and asks which items are needed to complete that mission. In a small store, mission-led ranging produces higher basket completion because it protects the low-velocity items that finish a basket.
Which metric matters most for deciding what stays in the range?
No single metric decides, but basket-completion rate is the one that most directly measures whether the range is doing its job. Velocity, attachment rate, waste rate and substitution acceptance sit alongside it, and a delisting usually needs two or three of them to line up over consecutive review cycles.
How do rapid delivery operators handle fresh produce without heavy waste?
They keep the produce list short (typically ten to fifteen core lines plus a small seasonal rotation), hold one to two days of cover, accept occasional evening out-of-stocks, and use dynamic in-app markdowns on items approaching their date. Waste above roughly 8 to 10 percent of receipts on a line is treated as a signal to shorten cover or delist.
What should happen when an item is out of stock?
The best practice is to decide the substitute when the item is ranged, not at pick time; to let the customer set a substitution preference in the app; to hide items from the app once they fall below a safety threshold; and to log every out-of-stock event as a ranging signal. Handled this way, a missing item costs a few cents of margin; handled badly, it is one of the top reasons customers leave a rapid delivery app.
How often should a quick commerce range be reviewed?
Monthly is the common cadence, with a weekly triage of “searched, not found” terms and out-of-stock logs in between. A typical review changes 3 to 5 percent of the range in and out, which is 60 to 100 lines in a 2,000-line store. More churn than that disrupts pick paths; less means the range is drifting away from demand.
Should every city have its own range?
Not entirely. The usual structure is a national core of 60 to 70 percent of slots that is identical everywhere, a regional layer of 20 to 30 percent, and a local layer of 5 to 15 percent that reflects the specific neighborhood. Local variation pays in produce, world foods, alcohol and impulse lines and barely pays in ambient grocery and household, and the local layer should be capped.
Why do larger ranges hurt a 15-minute delivery promise?
Because the picker is walking. Every additional line lengthens the pick path, increases shelf density and raises the chance of a mis-pick, and the picker has two to four minutes to assemble an order. Larger ranges also raise inventory cost and, in fresh and chilled, waste. Range discipline is now treated as part of unit economics rather than merchandising.
What to read next
Assortment is one of four levers that decide whether rapid delivery makes money, alongside rider density, dark store productivity and basket size, and the full picture is laid out in our guide to quick commerce economics. For the operational side of the same store, the piece on dark store layout, pick paths and staffing shows how the range decisions above translate into shelf plans and labor hours.