
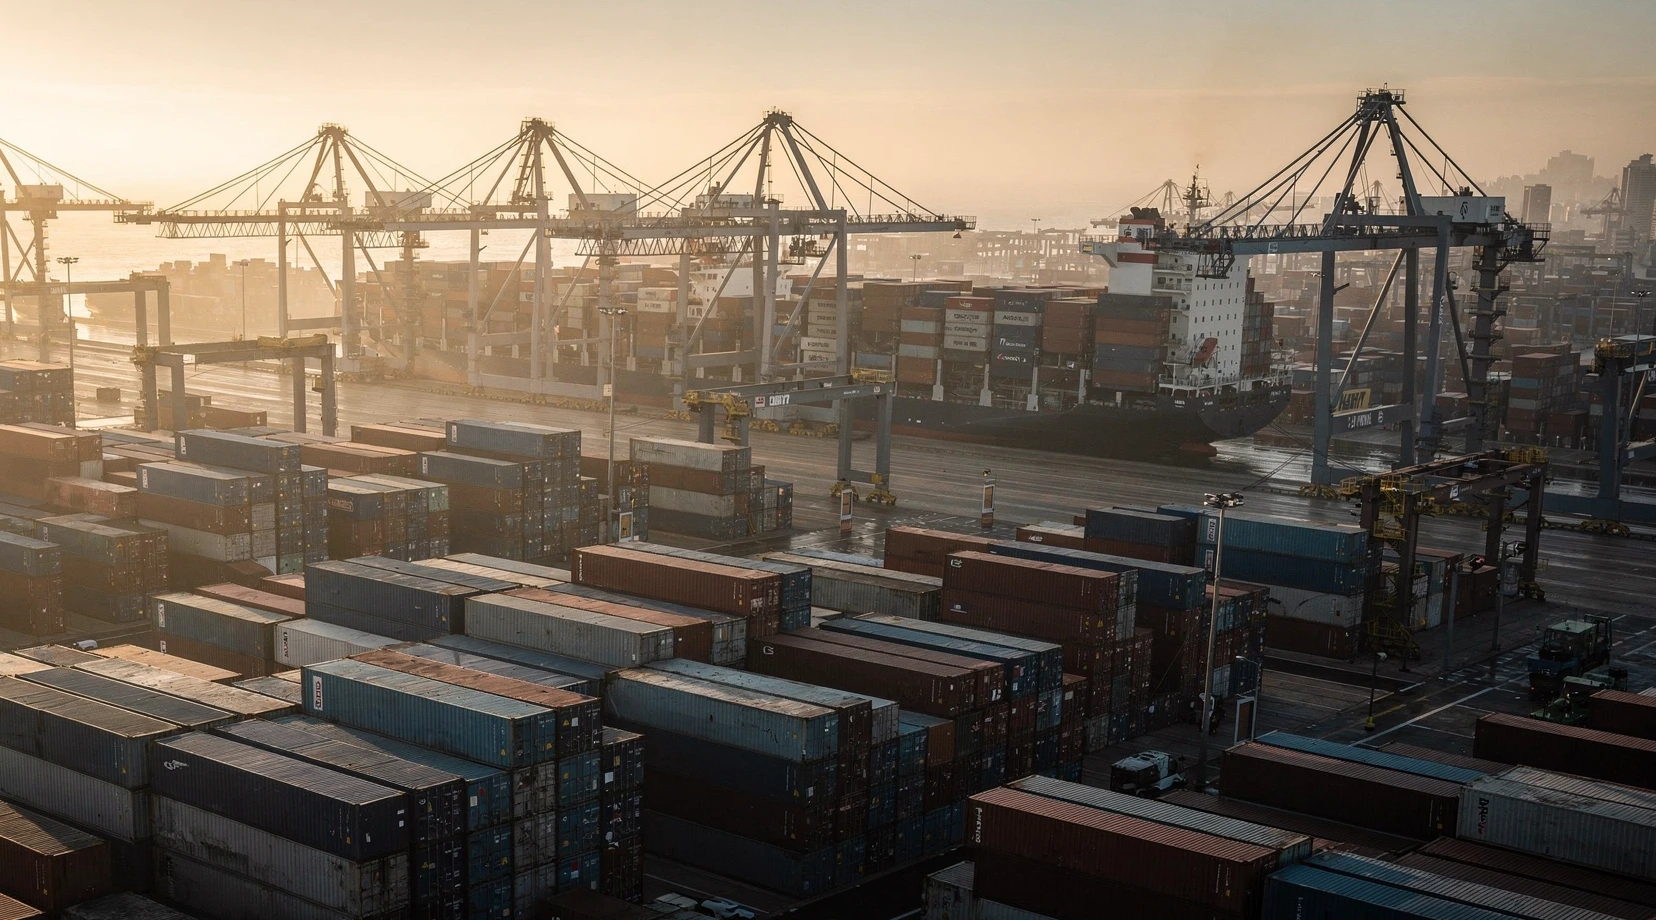
The US import peak that was supposed to be over by Labor Day is still running. The National Retail Federation’s Global Port Tracker, released September 10 with Hackett Associates, now forecasts 2.31 million twenty-foot equivalent units (TEU) for September, up 9.6% from a year earlier and enough to make it the busiest month of 2026. A month ago the same report had September pegged at 2.16 million TEU and called the early peak season “winding down.” The revision arrived alongside record volumes at the two largest US gateways: the Port of Los Angeles reported its best three-month stretch in history for June through August, and the Port of Long Beach posted its busiest August in 115 years.
For retailers, the numbers settle one debate and open another. Holiday inventory is arriving, and it is arriving on time. The open question is why volumes stayed high after the late-July tariff cliff that was expected to end front-loading, and what a full-year forecast of 25.7 million TEU (up 1%) means for freight rates, port capacity and tariff bills in the final quarter.
In short
- September is now the 2026 peak. NRF forecasts 2.31 million TEU, up 9.6% year over year, versus the 2.16 million TEU (up 2.8%) it projected on August 7.
- Full-year forecast raised to 25.7 million TEU, up 1% from 25.4 million in 2025. The August report had 25.5 million TEU, a gain of just 0.1%.
- Los Angeles handled 955,907 TEU in August and 2.9 million TEU across June, July and August, the strongest three consecutive months in the port’s history.
- Long Beach moved 919,992 TEU in August, up 2% year over year, its best August on record and reportedly its fifth-best month ever.
- Three forces are stretching the peak: resilient consumer demand, weather-delayed vessels from China and rerouting away from the Panama Canal amid drought concerns.
What did NRF change in the September Global Port Tracker?
The Global Port Tracker is a monthly forecast of inbound loaded container volume at 12 major US container ports on the West, East and Gulf coasts, produced by Hackett Associates for NRF. It reports actual figures with a two-month lag and forecasts six months ahead. The September edition, released September 10, replaces a “winding down” narrative with what NRF’s Jonathan Gold called an extended peak: “We thought the peak season would be mostly behind us by now, but that’s not the case.”
The headline change is September itself. The August 7 report forecast 2.16 million TEU for the month, up 2.8% from a year earlier. The September 10 report lifts that to 2.31 million TEU, up 9.6%, which would put it slightly ahead of July as the busiest month of the year. July’s actual figure came in at 2.3 million TEU, down 3.9% year over year but up 3.2% from June, and itself well above the 2.21 million TEU NRF had projected for July a month earlier.
August, still an estimate, is put at 2.29 million TEU, down 1.3% from August 2025. The August report had it at 2.22 million TEU, down 4.2%. So both the July actual and the August estimate landed roughly 70,000 to 90,000 TEU above the prior month’s projections, which is why the annual total moved up.
Forecast revisions, month by month
| Month | August 7 forecast (TEU, YoY) | September 10 forecast (TEU, YoY) | Change |
|---|---|---|---|
| July 2026 | 2.21 million (down 7.6%) | 2.30 million actual (down 3.9%) | +90,000 |
| August 2026 | 2.22 million (down 4.2%) | 2.29 million (down 1.3%) | +70,000 |
| September 2026 | 2.16 million (up 2.8%) | 2.31 million (up 9.6%) | +150,000 |
| October 2026 | 2.13 million (up 2.7%) | 2.11 million (up 1.7%) | -20,000 |
| November 2026 | 2.03 million (up 0.3%) | 2.00 million (down 0.9%) | -30,000 |
| December 2026 | 2.06 million (up 2.5%) | 2.03 million (up 1.1%) | -30,000 |
| January 2027 | not published | 2.09 million (down 1.0%) | new |
| Full year 2026 | 25.5 million (up 0.1%) | 25.7 million (up 1.0%) | +200,000 |
Source: NRF and Hackett Associates Global Port Tracker, August 7 and September 10, 2026 editions, as reported by NRF and trade press. Figures are rounded as published.
The pattern in the table matters as much as the September number. Everything from October onward was trimmed. NRF is not saying demand is stronger across the board; it is saying cargo that was expected earlier in the summer, or later in the autumn, is landing in September. That is a timing story with a demand floor under it, not a pure demand surge.
Why is peak season running late?
NRF and the ports point to three overlapping causes, and none of them is a new tariff deadline. The first is consumer demand. Gold’s statement on the report is direct: “Consumers keep buying despite tariffs, inflation and high fuel prices, and retailers keep bringing in merchandise to meet demand.” Hackett Associates founder Ben Hackett added that “retail sales remain strong and cargo is moving relatively smoothly,” despite tariff increases and fuel costs tied to the conflict with Iran.
The second cause is physical. NRF says part of the shift from earlier in the summer to now reflects vessel delays caused by bad weather in China. Cargo that would have sailed in July or August sailed later, and the counting moved with it. The third is routing: some carriers are steering away from the Panama Canal amid potential drought conditions there, which lengthens transit times on Asia-to-East-Coast strings and can push West Coast volumes up as shippers switch gateways.
The tariff calendar that did not end the surge
The August report had framed the summer as a classic front-loading episode. Retailers pulled cargo forward ahead of the July 23 expiry of the temporary 10% Section 122 global tariff and the July 24 start of new Section 301 duties of 10% to 12.5% tied to forced-labor findings, which NRF says cover 60 economies and affect roughly 99% of US imports. The expectation was that once those dates passed, volumes would fall back. Shopappy covered that setup as retailers raced a July 24 tariff cliff while ocean rates cooled.
Volumes did not fall back, at least not on the schedule NRF expected. That is the substance of the revision. The front-loading thesis was right about the timing of the summer surge and wrong about how quickly it would fade, because ordinary holiday replenishment, weather and canal routing filled the gap that the tariff deadline was supposed to leave.
What did the Port of Los Angeles report?
Los Angeles, the busiest US container port, processed 955,907 TEU in August. The port says that is 6% above its five-year average for the month and roughly level with August 2025. Across June, July and August the port moved more than 2.9 million TEU, which it describes as the strongest three consecutive months in its history. Trade press accounts citing port data say the summer total edged the previous 2021 record by only about 2,500 TEU, so the margin is thin, but the record stands.
The August breakdown shows where the strength sits. Loaded imports reached 500,302 TEU, essentially flat year over year but 7% above the five-year August average. Loaded exports fell 9% to 115,561 TEU.
Empty containers rose 4% to 340,044 TEU. That is what an import-heavy gateway looks like when boxes are being repositioned back to Asia faster than exports can fill them, and it is a cost line for carriers rather than a revenue line.
Year to date, the port has handled just over 7 million TEU through August, up 1.5% on the same period of 2025 and about 5% ahead of its five-year pace. Executive Director Gene Seroka said the port had “put together an exceptionally strong summer in Los Angeles,” attributing it to “resilient consumer demand, early holiday shipments and a broad mix of cargo.” On the outlook he added: “September is shaping up to be another strong month, and Los Angeles is well positioned to respond as global trade patterns continue to evolve.”
What the port’s guest said about demand
The port’s monthly media briefing featured Brian Dodge of the Retail Industry Leaders Association. Coverage of the briefing characterized the early holiday arrivals as a response to tariff uncertainty and supply chain pressure rather than evidence of a structural jump in demand, and stressed that inland routing efficiency now matters to importers as much as the ocean freight rate. Both points align with NRF’s framing: the peak is late and long, not necessarily bigger.
What did the Port of Long Beach report?
Long Beach, which shares San Pedro Bay with Los Angeles, moved 919,992 TEU in August, up 2% from August 2025. The port calls it the busiest August in its 115-year history, and trade press reports it as the fifth-best month the port has ever recorded. Imports rose 3.6% to 456,100 TEU, exports rose 4% to 99,754 TEU and empties slipped 0.4% to 364,138 TEU. Through August the port has handled 6.68 million TEU, up 1.3% year to date.
Chief Executive Noel Hacegaba’s statement tied the number directly to policy: “Our August numbers tell us that shippers continue to adapt to tariffs and geopolitical uncertainty and are confident in the Port of Long Beach’s ability to deliver.” Unlike Los Angeles, Long Beach reported growth in loaded exports, which is a small but useful signal that the outbound side of the trade is not uniformly weak.
San Pedro Bay, side by side
| August 2026 | Port of Los Angeles | Port of Long Beach | Combined |
|---|---|---|---|
| Total TEU | 955,907 (flat YoY) | 919,992 (up 2%) | 1,875,899 |
| Loaded imports | 500,302 (flat) | 456,100 (up 3.6%) | 956,402 |
| Loaded exports | 115,561 (down 9%) | 99,754 (up 4%) | 215,315 |
| Empties | 340,044 (up 4%) | 364,138 (down 0.4%) | 704,182 |
| Year to date (Jan–Aug) | about 7.0 million (up 1.5%) | 6.68 million (up 1.3%) | about 13.7 million |
| Headline record | Best three-month stretch (Jun–Aug: 2.9 million TEU) | Best August in 115 years |
Source: port press releases dated September 9–10, 2026, and trade press coverage. Combined figures are shopappy arithmetic on the published numbers.
Together the two ports handled close to 1.88 million TEU in August, and their combined loaded imports of roughly 956,000 TEU represent a substantial share of the 2.29 million TEU NRF estimates for the whole country. The San Pedro Bay complex is over-indexing on this peak, which is consistent with cargo diverting from Panama Canal routes and with the rail advantage that trade coverage says favors Los Angeles for inland distribution.
Does this mean holiday demand is stronger than forecast?
Not necessarily, and the retail forecasters are careful about the distinction. Bain’s holiday outlook, which shopappy examined when the firm called the first $1 trillion US holiday season, projected 4.5% nominal growth with more than half of it coming from inflation. NRF’s own language on the port data is about retailers bringing in merchandise “to meet demand,” which is a replenishment statement rather than a call that demand has accelerated.
The full-year container forecast tells the same story. A 1% increase in inbound TEU for 2026, following a 0.3% decline in 2025, is roughly flat in volume terms. What changed between the August and September reports is the shape of the year, with more cargo in the third quarter and less in the fourth, not the size of it. Retailers that pulled goods forward in the summer to beat tariff dates will need less in November and December, which is exactly what the trimmed October-to-December forecasts imply.
Tariff refunds and shelf prices
There is a second reason to be cautious about reading the port data as a demand signal. The Supreme Court’s ruling against tariffs imposed under the International Emergency Economic Powers Act has triggered refund claims from thousands of importers, and several retailers have started to pass those refunds into prices or promotions. Nintendo of America, for example, tied a two-week 30% sale this month to “tariff-related refunds,” according to multiple reports. Price cuts funded by refunds can lift unit volumes without any change in underlying consumer income, and imports would rise to support them.
The refund flow is also uneven. Retailers that acted as importer of record and filed claims early are receiving money now; those that relied on suppliers or marketplaces to import are waiting on pass-through negotiations, and some have no claim at all. That unevenness means the price cuts, and the replenishment imports behind them, are concentrated in particular categories such as consumer electronics and furniture rather than spread across the store, which is another reason the port volumes should not be read as a broad demand upgrade.
What happens to freight rates and port capacity?
A late peak changes the freight calculus for the fourth quarter. Spot rates on the transpacific rose sharply in late summer, and shopappy’s analysis argued the transpacific rate spike would unwind before mid-October as front-loaded cargo cleared. The September revision does not overturn that call, but it delays it. If September really is the busiest month of the year, carriers have less reason to blank sailings in late September and early October, and the rate relief that importers were expecting slides toward the second half of October.
On the port side, the record months have not produced the congestion of 2021. Hackett’s comment that “cargo is moving relatively smoothly” is consistent with the port statements, neither of which mentions dwell-time problems or vessel queues. Los Angeles and Long Beach have added capacity and rail throughput since the pandemic backlog, and a 2.9 million TEU quarter that passed without visible bottlenecks is itself a data point on how much headroom the West Coast now has.
The Panama Canal variable
The rerouting NRF describes is precautionary. Shippers are moving away from the canal because of potential drought conditions, not because draft restrictions have already been imposed. If the canal authority does restrict transits, the West Coast share of Asian imports rises further and East Coast ports see softer autumn numbers. If rainfall recovers, some of the diverted cargo returns to all-water services in the first quarter.
Either way, the shift explains part of why September’s national forecast rose while the port-level records concentrated in California.
What do the export and empty-container numbers say?
The import headline hides a weaker outbound story. Loaded exports through Los Angeles fell 9% year over year in August, and empties leaving the port rose 4%. Long Beach did better, with exports up 4%, but even there empties at 364,138 TEU outnumbered loaded exports by more than three to one. Across San Pedro Bay, roughly 704,000 empty containers moved in August against about 215,000 loaded export boxes.
That ratio is not new, but it is widening at the port that matters most. When imports run at record levels and exports soften, carriers have to ship boxes back to Asia empty, which raises their cost per loaded import slot and gives them a reason to hold rates up rather than let them fall. It also means the retaliation risk on US farm and manufactured exports, a live issue in the Canada dispute and in the Section 301 rounds with China, is already visible in the West Coast numbers before any new measure takes effect.
For retailers the export side is a second-order concern, but it feeds the rate outlook. An import peak with a healthy backhaul is cheaper for carriers to serve than an import peak with an empty backhaul. The 2026 peak is the second kind, which is one more reason the transpacific rate relief that was expected in early October may take longer to show up.
How are East Coast and Gulf ports likely to be affected?
The Global Port Tracker’s national forecast combines 12 gateways, but the September records reported so far come from the West Coast. The port-level data for New York and New Jersey, Savannah, Houston and the other East and Gulf Coast members is published on its own schedule, so the split of the 2.31 million TEU September forecast between coasts is not yet public. What NRF has said about Panama Canal rerouting implies the split is tilting west.
The mechanism is straightforward. Asia-to-East-Coast all-water services depend on the canal; when carriers reroute because of drought risk, they either go via Suez, which adds transit time and exposure to Red Sea and Gulf risk, or they land cargo on the West Coast and move it inland by rail. Trade coverage of the Los Angeles briefing highlighted the port’s rail connections as a reason importers prefer the Southern California routing when East Coast timing is uncertain. The combination of a record summer in San Pedro Bay and a flat-to-trimmed national fourth-quarter forecast is consistent with cargo shifting coasts rather than growing overall.
What would change the picture
Two developments would reverse the westward tilt. The first is rainfall in the Panama Canal watershed that removes the drought threat and lets carriers restore full-draft transits; that would send some diverted cargo back to all-water East Coast services from the first quarter of 2027. The second is a further deterioration in transpacific rates that makes the West Coast-plus-rail option more expensive relative to Suez routings. Neither is priced into the current forecast, and both are the kind of shift that shows up in the port data before it shows up in the national number.
Which trade and customs dates still sit in the fourth quarter?
The extended peak lands on a crowded compliance calendar. Importers moving cargo in the last weeks of September face several administrative changes that have nothing to do with demand but everything to do with whether containers clear. US Customs and Border Protection is scheduled to void inactive importer of record numbers on September 18, a step shopappy flagged because cargo tied to a voided number faces port holds until the importer re-registers. A late peak means more cargo is in transit exactly when that switch flips.
The macro calendar is equally dense. The Census Bureau publishes advance August retail sales on September 16, the same day as the Federal Reserve’s rate decision, a pairing shopappy previewed in its look at how August retail sales land September 16 against near-$4 gasoline. Strong port volumes and a soft retail sales print would be read as inventory building; strong volumes and a strong print would confirm NRF’s replenishment reading.
Further out, the September 29 effective date for the Section 338 import measures on certain Canadian goods, and the widening of the 50% Canadian tariff list on September 15, affect cross-border truck and rail more than container ports. But they add to the sense that the fourth quarter will be governed by trade rules changing mid-season, which is precisely the environment in which retailers prefer to hold inventory early rather than late.
How does 2026 compare with recent peak seasons?
The Global Port Tracker’s own history gives the context. Full-year volume was 25.5 million TEU in 2024, 25.4 million in 2025 and is now forecast at 25.7 million for 2026. The three years are within 1.2% of one another. What differs is timing.
In 2024 the peak came in the traditional August-to-October window. In 2025 it arrived early, in the spring, as importers moved ahead of successive tariff rounds. In 2026 the busiest month was first thought to be May at 2.24 million TEU, then July at 2.3 million, and is now forecast to be September at 2.31 million.
That drift tells retailers something about planning. Three years of near-identical annual volume with wildly different monthly shapes means the port system is being used as a buffer for policy uncertainty. Retailers are not importing more; they are importing when the rules are clearest. The NRF revision confirms that the “clear window” in 2026 extended further into the autumn than anyone forecast in August.
First half versus second half
NRF puts the first half of 2026 at 12.7 million TEU, up 1.1% from the first half of 2025. If the full-year forecast of 25.7 million holds, the second half comes to about 13.0 million TEU, marginally ahead of the first. In a normal year the second half runs well ahead because of the holiday build. A near-even split is the arithmetic signature of a year in which the holiday build started in May and never fully stopped.
What should retailers and importers do with this?
Three practical readings follow from the September data. First, the freight budget for October should assume rates stay elevated a few weeks longer than the August plan assumed. Blank sailings, the carriers’ main tool for supporting rates, are less likely while September volumes are still running at a record pace. Contract shippers with index-linked rates will feel this directly.
Second, inventory arriving in September is inventory that has to be financed, stored and eventually discounted if demand falls short of the replenishment thesis. With most of the fourth-quarter forecast trimmed, retailers should expect their own cargo flows to thin from mid-October, and plan promotional calendars around goods already in hand rather than goods on the water.
Third, the compliance risk is front-loaded too. Cargo cleared in the last two weeks of September will run into the CBP importer number reset, the new Section 301 rate structure introduced in July and, for anyone routing through Canada, the September 15 and September 29 changes. The cost of a customs hold on a container of holiday goods is measured in lost selling days, which is why the operational calendar deserves as much attention as the volume forecast.
FAQ
What is the NRF Global Port Tracker?
It is a monthly report produced by Hackett Associates for the National Retail Federation that tracks inbound loaded container volume at 12 major US container ports on the West, East and Gulf coasts. It publishes actual figures with a two-month lag and forecasts six months ahead, measured in twenty-foot equivalent units (TEU).
What is the September 2026 import forecast?
NRF forecasts 2.31 million TEU for September 2026, up 9.6% from September 2025. That is 150,000 TEU above the 2.16 million TEU it projected on August 7 and would make September the busiest month of the year, slightly ahead of July’s 2.3 million TEU.
Why did NRF raise its forecast?
NRF cites three factors: consumers continuing to buy despite tariffs, inflation and high fuel prices; vessel delays caused by bad weather in China that pushed cargo later into the summer; and some rerouting away from the Panama Canal amid potential drought conditions. Actual July volume and estimated August volume both came in above the prior forecast.
What records did Los Angeles and Long Beach set?
Los Angeles handled 955,907 TEU in August and more than 2.9 million TEU across June, July and August, the strongest three consecutive months in its history. Long Beach moved 919,992 TEU in August, up 2%, its best August in 115 years and reportedly its fifth-best month ever.
Is 2026 import volume actually higher than 2025?
Only slightly. NRF’s full-year forecast is 25.7 million TEU, up 1% from 25.4 million in 2025 and close to the 25.5 million recorded in 2024. The change in 2026 is mainly in timing, with more cargo in the third quarter and less in the fourth, rather than in total volume.
What does the late peak mean for ocean freight rates?
It probably delays the rate relief importers were expecting. With September running at record pace, carriers have less reason to cut capacity in late September and early October, so transpacific spot rates may stay elevated a few weeks longer than earlier forecasts assumed.
Which tariff changes are driving the timing?
The summer surge was tied to the July 23 expiry of the temporary 10% Section 122 global tariff and the July 24 start of Section 301 duties of 10% to 12.5% linked to forced-labor findings. Later in the quarter, changes to the 50% tariff list on Canadian goods take effect September 15 and Section 338 import measures on certain Canadian products start September 29.
What do the forecasts say about October to December?
NRF trimmed all three months compared with its August report: October is now 2.11 million TEU (up 1.7%), November 2.0 million (down 0.9%) and December 2.03 million (up 1.1%). January 2027 is forecast at 2.09 million TEU, down 1%.
Does record port volume mean holiday sales will be strong?
Not by itself. NRF describes retailers as bringing in merchandise to meet demand, and the Port of Los Angeles cites early holiday shipments and a broad cargo mix. Retail forecasters such as Bain expect nominal holiday growth of about 4.5% with more than half of that from inflation, so the port data is better read as a replenishment and timing signal than as a demand upgrade.