
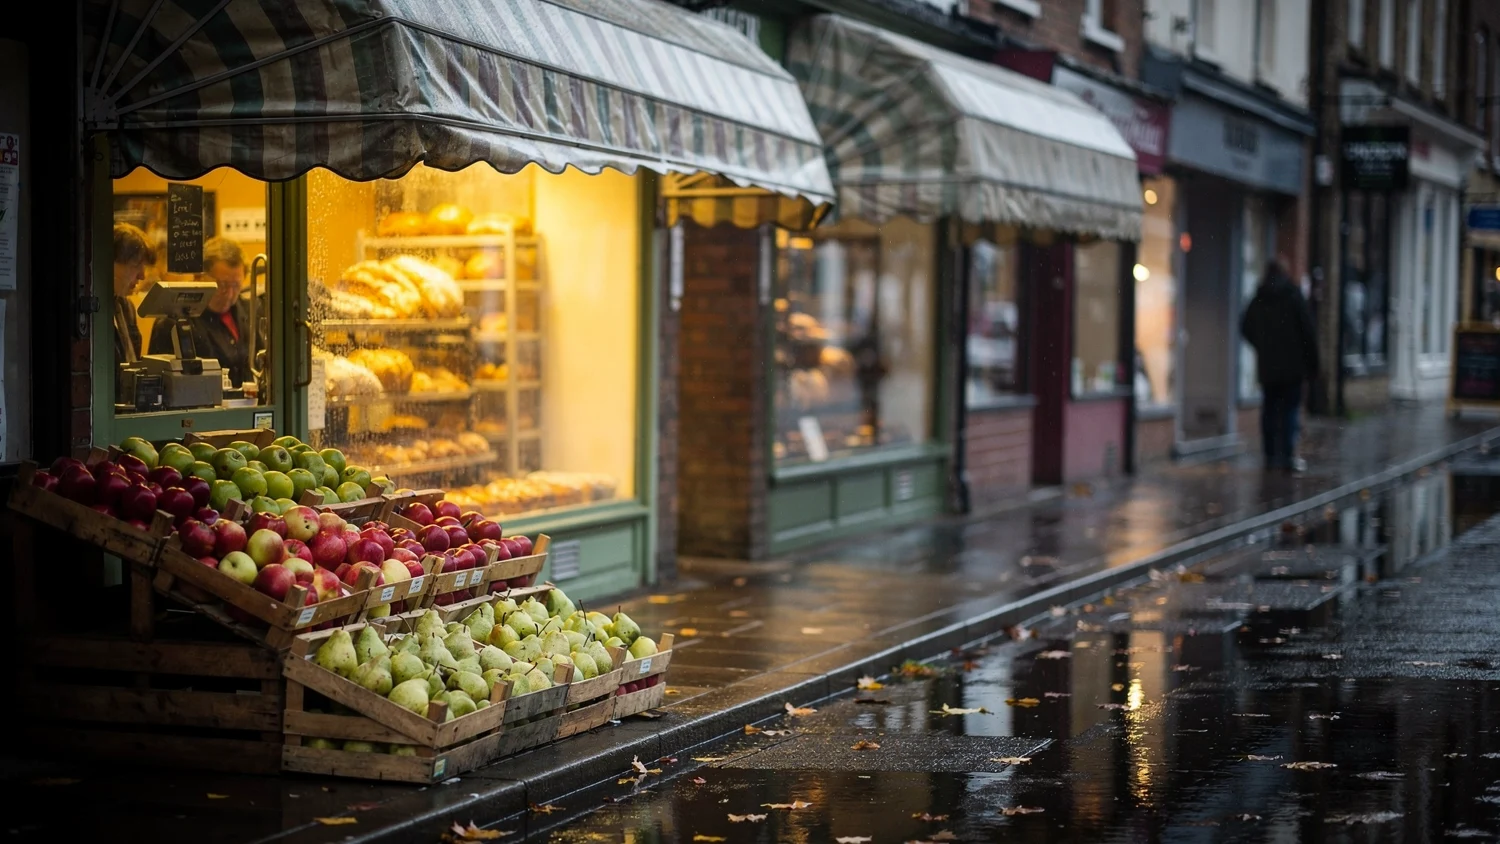
The Office for National Statistics publishes Retail sales, Great Britain: August 2026 at 7:00am on Friday 18 September. It is the first official reading of how shops traded once the early-summer heat faded, and it arrives two days after the August inflation print and one day after the Bank of England’s September rate decision. The private-sector data already released for the month points in one direction: food is still growing, non-food is shrinking, and the overall number is likely to be soft.
For UK shoppers and independent retailers the release matters more than most monthly prints. It is the last full picture of consumer demand before the Autumn Budget on 28 October, and it lands in the same week as results from Next and a rate decision that could set the cost of borrowing into Christmas trading.
In short
- Release date: ONS retail sales for August 2026 are published at 7:00am on Friday 18 September, covering sales volumes and values for Great Britain.
- The July base: volumes fell 0.5% in July after a downwardly revised 0.7% rise in June; annual growth slowed to 1.6% from 3.8%.
- What August already shows: the BRC-KPMG monitor put total sales up just 0.7% year on year, with food up 2.6% and non-food down 0.8%; Barclays card data showed retail up 1.2% but department stores down 2.2%.
- Confidence is improving, spending is not: GfK’s index rose to -14, its best level in two years, yet shoppers held back on big-ticket items as household bills rose.
- The week around it: August CPI on Wednesday 16 September, the Bank of England decision on Thursday 17 September (Bank Rate 3.75%), Next’s half-year results the same day, then the ONS print on the Friday.
When are the UK retail sales figures for August 2026 published?
The ONS release is scheduled for 7:00am BST on Friday 18 September 2026 under the title “Retail sales, Great Britain: August 2026”. It provides a first estimate of retail sales in volume and value terms, both seasonally and non-seasonally adjusted, according to the ONS release calendar. The July bulletin, published on 21 August, listed 18 September as its next release date, so the timing is confirmed on two official pages.
The bulletin covers the four weeks to 29 August in the retail sales index reference period, and the ONS typically publishes the headline monthly change, the three-month-on-three-month comparison, the annual comparison and a split by store type. Revisions to June and July will be published alongside the new August estimate. Those revisions matter this month because the ONS has already moved June twice.
Anyone tracking the number should also note the sequence of the week. The August consumer price inflation figures land on Wednesday 16 September at 7:00am, the Bank of England’s Monetary Policy Committee announces its decision at noon on Thursday 17 September, and the retail sales bulletin follows on the Friday morning. The official ONS release page is at ons.gov.uk.
| Date | Release | Time (BST) | Why it matters for retail |
|---|---|---|---|
| Wed 16 September | ONS consumer price inflation, August 2026 | 7:00am | July CPI rose to 2.9%; a further rise squeezes real incomes into autumn |
| Thu 17 September | Bank of England MPC decision | 12:00pm | Bank Rate has been 3.75% since late 2025; three members voted for a rise in July |
| Thu 17 September | Next plc half-year results | 7:00am | Largest listed UK clothing retailer; a read on full-price demand |
| Fri 18 September | ONS retail sales, Great Britain: August 2026 | 7:00am | First official volume and value estimate for August, plus June and July revisions |
| Wed 28 October | Autumn Budget 2026 | TBC | Business rates and employment costs are the retail sector’s headline asks |
What did the July figures say, and why is the base so awkward?
Retail sales volumes fell 0.5% in July 2026, the first monthly decline since April, according to the ONS bulletin published on 21 August. That followed a 0.7% rise in June, which the ONS revised down from the 1.0% it had first reported, and a 1.3% rise in May, revised up from 1.2%. The July decline was in line with market expectations at the time, and Reuters reported that annual volume growth slowed to 1.6% from 3.8% in June.
The three-month picture was healthier than the single month. Sales volumes in the three months to July rose 1.1% compared with the three months to April, and were 3.0% higher than the same period a year earlier. The ONS said non-store retailers had a strong quarter on promotions and outdoor and sports merchandise, food stores benefited from supermarket strength, non-food stores rose 1.0%, and automotive fuel declined.
Within July itself, non-food store volumes dropped 1.3%. The ONS said clothing retailers cited lower footfall in the hot weather and fewer promotions, household goods stores reported reduced demand, and department stores were affected by stock availability. Earlier promotional activity had shifted purchases from July into June, which is the same pull-forward pattern the BRC and KPMG later described for the whole summer.
The online share slipped in July
The proportion of retail sales made online fell to 28.3% in July from 29.2% in June, according to the ONS. Online sales values fell 3.9% on the month but were still 6.5% higher than a year earlier. When shopappy.com covered the May retail sales figures, the online share stood at 28.8%, so the summer has seen the share move within a fairly narrow band rather than resuming a structural climb.
Total sales volumes in July were 0.1% below their pre-pandemic level of February 2020. That single comparison summarises six years of British retail: values have risen with prices, but the physical quantity of goods sold has gone almost nowhere.
What does the BRC-KPMG monitor already tell us about August?
The British Retail Consortium and KPMG published their Retail Sales Monitor for the four weeks from 2 to 29 August in the week beginning 7 September. Total UK retail sales rose 0.7% year on year, down from 1.3% in July and well below the 3.1% growth recorded in August 2025. Like-for-like sales rose 0.5%, down from 1.0%, and the 12-month average growth rate was 1.6%.
The split by category was stark. Food sales rose 2.6%, slowing from 3.8% in July and 4.7% in August 2025. Non-food sales fell 0.8% year on year, after a 0.7% fall in July, and against 1.8% growth in August 2025. In-store non-food sales fell 1.2% while online non-food sales fell 0.2%, which lifted online penetration of non-food purchases to 36.4% from 36.0% a year earlier.
Harvir Dhillon, the BRC’s lead economist, described August as a disappointing month for retail sales, saying rising household bills were encouraging consumers to rein in spending and that shoppers were cautious about big-ticket purchases. Linda Ellett, KPMG’s UK head of consumer, retail and leisure, said summer spending had started in May this year as higher temperatures pulled forward seasonal purchases, and that most categories beyond food, drink, health and beauty struggled in August.
How the monitor maps onto the ONS print
The BRC monitor measures sales values reported by member retailers, not volumes, and it covers a different sample and calendar from the ONS. It is not a forecast of the official number, but historically the direction of travel tends to match. A value reading of 0.7% growth against inflation running at 2.9% in July implies falling real volumes, which is the arithmetic that should worry anyone hoping for a bounce after July’s 0.5% decline.
The July ONS bulletin reported annual volume growth of 1.6% while the July BRC monitor reported value growth of 1.3%. If the August relationship is similar, the ONS annual volume figure would be close to flat or slightly positive, and the monthly change could be negative for a second month. That is inference rather than reporting, and the official estimate will carry sampling and seasonal adjustments that the private data does not.
| Indicator (August 2026) | Headline | Food or essential | Non-food or discretionary | Source and period |
|---|---|---|---|---|
| BRC-KPMG Retail Sales Monitor | Total sales +0.7% y/y; LFL +0.5% | Food +2.6% | Non-food -0.8%; in-store non-food -1.2% | BRC and KPMG, 2–29 August |
| Barclays Consumer Spend | Card spending +2.1% y/y, 13-month high | Retail +1.2%; clothing +0.9% | Department stores -2.2%; pharmacy, health and beauty -0.2% | Barclays card data, 24 July–20 August |
| GfK Consumer Confidence | Index -14, up 3 points, two-year high | Personal finances next 12 months +4 | Major purchase index -7, up 5 points | GfK, August survey |
| ONS retail sales (July base) | Volumes -0.5% m/m; +1.6% y/y | Food stores positive over 3 months | Non-food stores -1.3% m/m in July | ONS, published 21 August |
What did Barclays card data show for August?
Barclays published its August Spend Trends report on 8 September. Overall card spending rose 2.1% year on year, the strongest growth in 13 months and up from 2.0% in July. Online spending grew 2.6% and face-to-face spending grew 1.7%. Barclays’ issuing business sees roughly 40% of UK credit and debit card transactions, and the spending data compared 24 July to 20 August 2026 with the equivalent period in 2025.
The retail detail was weaker than the headline. Retail sales rose 1.2% with transaction growth of 1.7%. Clothing sales rose 0.9% on transaction growth of 6.1%, which suggests more purchases at lower average values. Department store sales fell 2.2% with transactions down 3.9%, and pharmacy, health and beauty sales fell 0.2%.
The growth was elsewhere. Travel spending rose 3.1%, its highest rate of 2026, with airlines up 3.5% and travel agents up 4.4%. Entertainment rose 5.9% on transaction volumes up 10.7%, hospitality and leisure rose 3.3%, pubs, bars and clubs rose 2.7%, and digital content and subscriptions rose 7.2%. Consumers were spending, but on experiences and services rather than goods in shops.
Confidence up, caution intact
Barclays’ accompanying survey, conducted by Opinium among 2,000 respondents between 21 and 25 August, found 66% of consumers confident in their household finances, a six-month high and up from 64%. Confidence in non-essential spending edged up to 54% from 53%. Confidence in the UK economy fell to 26% from July’s 30%, which Reuters noted had been a 21-month high, though it remained above the 2026 average of 24%.
Price concerns remain widespread. Some 84% of respondents were concerned about rising prices, 77% about shrinkflation, 76% about declining product quality, 72% about drip pricing and 71% about dynamic pricing. Jack Meaning, chief UK economist at Barclays, said consumer spending and confidence remained resilient in August even as pressures from the Middle East began to filter into prices, and that squeezed households may need to be more discerning if the situation persists or intensifies.
Why is consumer confidence at a two-year high while shops struggle?
GfK’s Consumer Confidence Index rose three points to -14 in August, its highest level for two years and well ahead of the -25 recorded in April. Neil Bellamy, consumer insights director at GfK, said it was too soon to tell whether people had greater faith in the new government or could see an end to the cost-of-living squeeze. Expectations for personal finances over the next 12 months rose three points to +4, and the major purchase index rose five points to -7, its best reading since December 2021.
The gap between improving sentiment and weak non-food sales is the puzzle the ONS print will help resolve. One explanation is timing: the GfK survey and the Barclays survey were conducted in the second half of August, while much of the BRC’s non-food weakness reflected purchases pulled forward into May and June by the early heat. Another is composition: confidence about personal finances rose most among households that were already spending on travel and leisure, not on furniture and appliances.
Bellamy also flagged the constraint. Inflation stood at 2.9% in July, its highest in four months, and uncertainty in the Middle East and elsewhere left many challenges ahead for UK consumers. A confidence index that improves while real incomes are being squeezed by energy-driven inflation tends to show up in services spending first and in goods volumes last.
Which retailers have already reported on the summer?
Three sets of company numbers published this week give a category-by-category read on the period the ONS is about to measure. John Lewis Partnership reported first-half results on 10 September showing a pre-tax loss of £124 million and a loss before exceptional items of £89 million, up from £34 million a year earlier. John Lewis department store sales fell 2%, Waitrose sales rose 4%, and chairman Jason Tarry cited a more challenging trading environment and the increased costs of doing business. The split, which shopappy.com covered in detail in its report on the John Lewis Partnership half-year loss, is the BRC’s food-up, non-food-down pattern inside a single company.
Currys’ AGM trading update on 10 September went the other way for electricals. Group like-for-like sales rose 7%, with UK and Ireland up 6%, and the company held its profit guidance. That is consistent with the ONS commentary that hot weather boosted demand for fans and cooling products earlier in the summer, and with Barclays’ finding that transaction counts were growing faster than values in several categories. Our coverage of Currys’ 7% sales rise under its new chief executive sets out the UK share gains in a flat market.
Next reports its half-year results on Thursday 17 September, the morning before the ONS release. Its second-quarter trading statement had already shown full-price sales up 9.2%, well ahead of guidance, but with UK store sales down 0.3% and the growth coming from online and international. The pattern at Next, which shopappy.com previewed in Next’s £1.24bn profit test, is another version of the same story: total demand holding up in value terms while physical shop volumes drift lower.
What Primark’s move says about the ONS store-type split
Associated British Foods confirmed on 10 September that Primark will offer home delivery in Great Britain for the first time, after acquiring an automated fulfilment centre in Sheffield from Debenhams Group for a reported £90 million. Primark’s business has been almost entirely in-store, so the decision reflects a judgement that the channel mix in clothing has shifted far enough to justify the cost. The ONS non-food online penetration figures in the August bulletin will show whether the shift resumed after the July dip.
| Retailer | Update and date | Headline figure | Read-across to the ONS August print |
|---|---|---|---|
| John Lewis Partnership | H1 results, 10 September | Loss before exceptionals £89m; John Lewis -2%, Waitrose +4% | Department stores weak, food resilient |
| Currys | AGM trading update, 10 September | Group LFL +7%; UK and Ireland +6% | Electricals volumes supported by weather and replacement demand |
| Next | H1 results due 17 September | Q2 full-price sales +9.2%; UK stores -0.3% | Clothing value up, store volumes flat to down |
| Primark (ABF) | Trading update, 10 September | Home delivery confirmed; Sheffield site bought for ~£90m | Channel shift continuing in value clothing |
| Matalan | AW26 range launch, 12 September | FY26 loss £54.7m; 40 store refits planned | Autumn ranges landed after the ONS reference period |
What happens on inflation and interest rates in the same week?
The ONS publishes August consumer price inflation at 7:00am on Wednesday 16 September. Headline CPI rose to 2.9% in July from 2.6% in June, the first increase in the annual rate since March 2026, driven in part by energy costs linked to the conflict in the Middle East. Rob Wood, chief UK economist at Pantheon Macroeconomics, said after the July retail figures that consumer spending would be squeezed in the coming months as energy costs pushed inflation towards 3%.
The Bank of England’s Monetary Policy Committee announces its decision at noon on Thursday 17 September. Bank Rate has stood at 3.75% since late 2025, and the committee voted 6–3 to hold in July, with Megan Greene, Catherine Mann and Huw Pill each preferring a quarter-point rise to 4.00%, according to the published minutes. A rise on 17 September would raise borrowing costs for retailers and mortgage holders just as Christmas stock is being financed.
The sequence means the retail sales print on the Friday will be read through whatever the Bank has just done. A hold would leave the August sales figures as a straightforward demand reading. A rise would frame them as the last data point before tighter policy, and would sharpen the question of how much non-food spending can withstand.
Why the Budget is the real deadline
Chancellor John Healey used his growth speech on 7 September to acknowledge that the cost of doing business, which he listed as energy bills, regulation, planning constraints and labour costs, had grown since Covid, and he confirmed that the Budget on 28 October would set out a roadmap to fiscal devolution including greater business rates retention for councils. Andrew Goodacre, chief executive of the British Independent Retailers Association, responded that the chancellor must use the Budget to act on business rates and the cost of employment rather than announce further reviews. The August and September retail sales prints are the last two full months of evidence before that Budget is finalised.
What should independent retailers watch for in the release?
For a single shop, the national headline matters less than the store-type detail. The ONS breaks down sales by food stores, non-food stores (with sub-categories for department stores, clothing, household goods and other stores), non-store retailers and fuel. Independent retailers should compare their own August with the relevant sub-category rather than with the total, because the total is dominated by supermarkets and online.
Three lines deserve attention. First, the household goods and furniture reading, which the BRC identified as the category where shoppers held back most. Second, the clothing volume figure, which will show whether the transaction growth Barclays recorded translated into more goods sold or simply cheaper ones. Third, the online share of non-food, which at 36.4% in the BRC data is now more than a third of the category.
The CBI’s distributive trades survey gives a further steer. When shopappy.com covered the CBI gauge falling to a two-year low in June, the survey was already pointing to weak expectations among retailers for the summer. The subsequent ONS prints for June and July were stronger than the CBI mood suggested, largely because of the heat, which is one reason to be careful about reading any single indicator as the answer.
Revision risk cuts both ways. The ONS revised June down from 1.0% to 0.7% and May up from 1.2% to 1.3% in the July bulletin, and revisions of that size are normal for the retail sales index.
If July’s 0.5% fall is revised to a smaller decline, August starts from a slightly higher base and a flat month looks worse. If July is revised further down, a modest August rise is possible without any real improvement in demand. Readers should check the revised July figure before interpreting the August one.
Common mistakes when reading the retail sales release
- Confusing values with volumes. The headline ONS figure is a volume index, adjusted for price changes. The BRC monitor and Barclays data are values. With inflation at 2.9%, a value rise of 2% is a volume fall.
- Ignoring the three-month comparison. Monthly changes in the retail sales index are volatile and heavily revised. The three-month-on-three-month figure, which was +1.1% in July, is a steadier guide.
- Reading the BRC monitor as a forecast. It covers member retailers’ reported sales values in a four-week window. It is directional evidence, not an estimate of the ONS number.
- Treating confidence surveys as spending. GfK’s two-year high in August coincided with the BRC’s weakest non-food reading in months. Sentiment leads services spending far more reliably than it leads goods volumes.
- Forgetting the weather. The ONS, BRC and KPMG all attributed the summer pattern to early heat pulling purchases into May and June. August comparisons are against an August 2025 that saw 3.1% value growth, so the base is demanding.
- Skipping the online share. The proportion of sales online moved from 28.8% in May to 29.2% in June to 28.3% in July. Small moves in that line change how much of any decline is a high street problem rather than a demand problem.
FAQ: UK retail sales August 2026
When exactly are the August 2026 retail sales figures released?
The ONS publishes “Retail sales, Great Britain: August 2026” at 7:00am BST on Friday 18 September 2026. The July bulletin, published on 21 August, listed 18 September as the next release date, and the ONS release calendar entry confirms it. The bulletin covers sales volumes and values, seasonally and non-seasonally adjusted, and includes revisions to June and July.
What did UK retail sales do in July 2026?
Sales volumes fell 0.5% in July, the first monthly decline since April, after a 0.7% rise in June that was revised down from 1.0%. Annual growth slowed to 1.6% from 3.8%. Non-food store volumes dropped 1.3% as clothing and household goods retailers reported lower footfall in the heat and fewer promotions. Over the three months to July, volumes rose 1.1% on the previous three months and 3.0% on a year earlier.
What is the BRC-KPMG monitor saying about August?
Total UK retail sales rose 0.7% year on year in the four weeks from 2 to 29 August, down from 1.3% in July and 3.1% in August 2025. Food sales rose 2.6% and non-food sales fell 0.8%, with in-store non-food down 1.2%. The BRC’s Harvir Dhillon called it a disappointing month, citing rising household bills and caution about big-ticket purchases. The 12-month average growth rate is 1.6%.
Does the Barclays data contradict the BRC?
Not on retail. Barclays reported overall card spending up 2.1%, a 13-month high, but retail spending rose only 1.2%, department stores fell 2.2% and pharmacy, health and beauty fell 0.2%. The stronger growth was in travel (+3.1%), entertainment (+5.9%) and hospitality (+3.3%). Both datasets show consumers spending on services and essentials while holding back on discretionary goods.
Why does consumer confidence look better than sales?
GfK’s index rose to -14 in August, a two-year high, and its major purchase index reached its best level since December 2021. But the surveys were conducted in late August, after much of the summer’s non-food spending had been pulled forward by early heat into May and June. Confidence about personal finances also tends to show up first in services such as travel and eating out, which is exactly where Barclays recorded the strongest growth.
How do inflation and the Bank of England decision fit in?
August CPI is published on Wednesday 16 September; July’s rate was 2.9%, the first rise since March. The Bank of England announces its decision at noon on Thursday 17 September. Bank Rate is 3.75% and three of nine committee members voted for a rise in July. The retail sales print on Friday 18 September will therefore be read alongside a fresh inflation number and a rate decision made the previous day.
Which company results give a read on the same period?
John Lewis Partnership reported first-half results on 10 September with department store sales down 2% and Waitrose up 4%. Currys reported group like-for-like sales up 7% the same day. Next publishes half-year results on 17 September after a second quarter in which full-price sales rose 9.2% but UK store sales fell 0.3%. Together they mirror the BRC pattern of food and electricals holding up while department stores and physical clothing volumes soften.
What is the online share of retail sales in the UK now?
The ONS put the proportion of retail sales made online at 28.3% in July 2026, down from 29.2% in June and 28.8% in May. Online sales values fell 3.9% on the month in July but were 6.5% higher than a year earlier. For non-food alone, the BRC monitor recorded online penetration of 36.4% in August, up from 36.0% a year earlier.
Why do the August figures matter for the Autumn Budget?
The Budget is on Wednesday 28 October 2026, and the August and September retail sales prints are the last two full months of demand data before it is finalised. Chancellor John Healey has acknowledged that business costs have risen since Covid and promised a fiscal devolution roadmap including greater business rates retention for councils. Retail trade bodies including Bira are pressing for action on business rates and employment costs rather than further reviews.
What to do before Friday
Retailers preparing for the release should pull their own August sales by category, compare them with the BRC’s food and non-food split, and have the July ONS store-type table to hand so that revisions can be checked quickly on the morning. Anyone modelling Christmas trading should also note the Bank of England decision on the Thursday, since a change in Bank Rate would alter the cost of stock financing before the ONS number is even published. The Next results on the same Thursday will offer the clearest company-level read on clothing demand before the official figures arrive.