
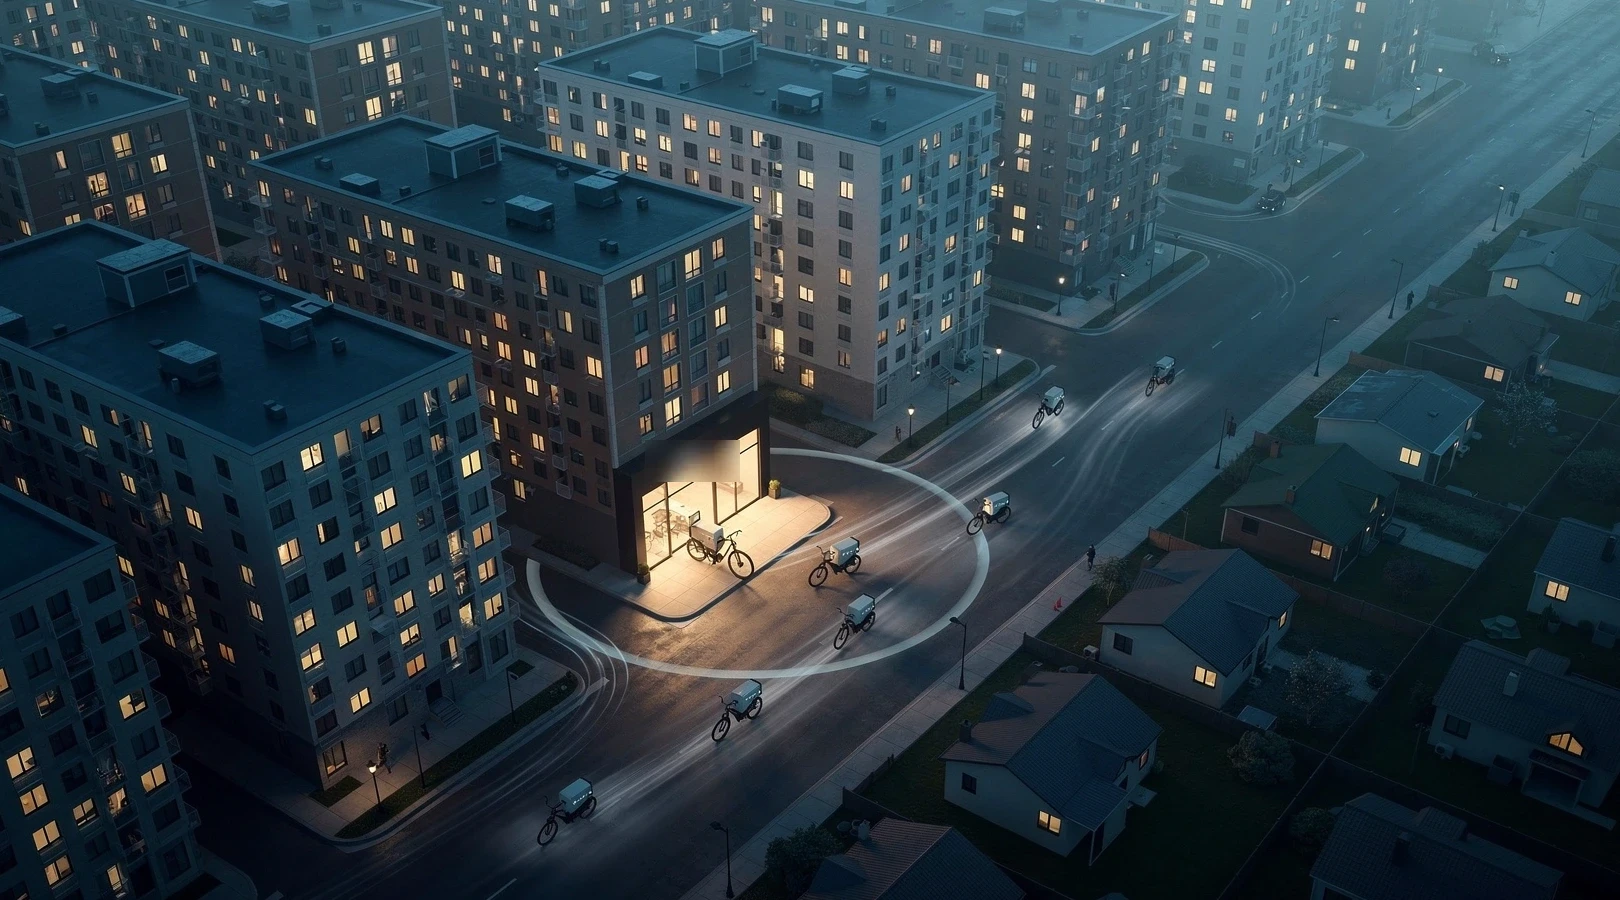
The same rapid grocery model that reaches profitability in one city can burn through its entire funding round in the next, with the same app, the same dark store template and the same 15-minute promise. Between 2020 and 2024 the sector produced a natural experiment on a scale that rarely happens in retail: dozens of operators launched near-identical concepts across hundreds of cities, and the results diverged sharply by geography rather than by brand. This article sets out the city-level variables that explain most of that divergence, and turns them into a scoring framework for judging whether a new market can carry a quick commerce operation at all.
In short
- Population density is the single strongest predictor, because it sets how many orders per hour a dark store can pull from a catchment a rider can cover in under ten minutes.
- Car ownership defines the competing option: where a store run is a five-minute drive with free parking, the convenience premium of rapid delivery shrinks toward zero.
- Wage levels and rider supply set the cost floor per drop; a city where a delivery costs the operator $9 in labor needs a very different basket than one where it costs $1.50.
- Basket value and fee tolerance decide whether the customer or the operator absorbs that cost, and the answer flips as soon as promotional subsidies end.
- Dark store rent per square foot, combined with the number of stores a city needs for coverage, determines the fixed-cost hurdle every order has to clear before the model turns positive.
What decides whether quick commerce works in a city?
Quick commerce, meaning grocery and convenience delivery from small urban dark stores in roughly 10–30 minutes, is a local business dressed up as a global platform. Every dark store is a stand-alone profit and loss statement with a catchment radius of about one to two miles, and the app on top of it adds surprisingly little leverage. That is why the sector’s history reads like a map: the operators that survived did so in specific cities, and the ones that collapsed usually failed city by city before they failed as companies. For the full background on how the model is built, the pillar guide on quick commerce economics, dark stores and rapid delivery walks through the operating model from the store floor up.
Five variables explain most of the difference between a viable market and a doomed one: population density, the alternatives shoppers already have (mostly car ownership and store proximity), local wage levels and rider supply, average basket value together with fee tolerance, and real estate cost for a dark store footprint. They interact rather than add up. A dense city with high wages can work if baskets are large; a sprawling city with cheap labor can work if riders on motorbikes cover wide catchments. What does not work is a city that fails on three or more variables at once, which describes most of the markets that were abandoned between 2022 and 2024.
The industry’s early narrative was about product and capital: who had the best app, who raised the most, who could subsidize longest. Getir, Gorillas, Jokr, Buyk, Fridge No More and Zapp all launched with similar dark store templates and, according to company statements and press reporting, most subsequently exited or shut the majority of their Western markets, while operators in Istanbul, Mumbai, Bengaluru and Shanghai kept growing on thinner funding. The difference was not the app. It was the city.
Why the model is so sensitive to geography
A dark store’s fixed costs are largely committed before the first order: rent, fit-out, shelving, refrigeration, a store manager and a minimum staffing roster. Revenue, by contrast, scales with orders per hour, and orders per hour are a direct function of how many households sit inside the delivery radius and how often they are willing to pay for the convenience. Small changes in either number move the store from loss to profit. A store doing 25 orders per hour at peak looks nothing like the same store doing 8, even though both cost roughly the same to run.
Rider economics amplify the effect. A courier who can complete four drops per hour in a dense neighborhood is costing the operator a quarter of what the same courier costs per drop when the roads are wide, the buildings are single-family and the average trip is two miles each way. The math behind how many drops a rider can chain is covered in detail in rider batching and drop density: the math behind rapid delivery promises, and it is the mechanism through which density gets converted into margin.
How does population density set the catchment a dark store can serve?
The delivery promise fixes the catchment. If the pitch is 10–15 minutes and picking takes two to three minutes, a rider on an e-bike has around eight to ten minutes of travel time, which translates to a radius of roughly one mile in a congested city core and perhaps a mile and a half where the streets are clearer. Everything about the store’s economics then depends on how many people live inside that circle and how many of them the operator can convert.
Manhattan packs in the order of 70,000 residents per square mile, according to US Census Bureau population estimates. Inner London boroughs run around 25,000 to 40,000 per square mile. A typical American suburb sits at 2,000 to 4,000, and even a “dense” Sun Belt city like Phoenix or Houston averages under 4,000 across its municipal area. A one-mile-radius catchment covers about 3.1 square miles, so the same dark store template addresses more than 200,000 residents in Manhattan and perhaps 10,000 in a suburb, a twentyfold difference before a single marketing dollar is spent.
Order density per hour is the real metric
Residents are not orders. What operators actually track is order density: completed orders per hour per square mile of catchment, which combines population, adoption rate and ordering frequency. Publicly reported figures from the sector’s more transparent players suggest that a dark store needs somewhere in the range of 15–30 orders per hour at peak, and a few hundred per day, to cover its fixed costs at a normal basket. Hitting that from 10,000 residents would require an adoption rate no consumer service has ever achieved, while hitting it from 200,000 residents requires a few percent of households ordering a couple of times a week, which is plausible.
Vertical density beats horizontal density
Not all density is equal. A neighborhood of high-rise apartment towers with a doorman or a parcel room lets a rider complete several drops without moving the bike, because multiple customers share an address. Detached homes with driveways and setback front doors are the worst case, because every drop is a separate stop with its own dismount, walk and hand-off. Two cities with the same headline density figure can produce very different rider throughput depending on how the housing is built, which is why Istanbul and Mumbai outperform what their density numbers alone would predict.
What alternative do shoppers already have?
The second variable is the substitute. Rapid delivery is competing against whatever the shopper would otherwise do to get the same items, and the strength of that alternative varies more by city than almost anything else in retail. In a car-dependent metro the alternative is a short drive to a large-format supermarket with free parking, which is fast, cheap and offers a wider range than any dark store. In a transit city with limited parking, the alternative is a walk or a bus trip carrying bags, and the convenience gap that quick commerce fills is much wider.
Car ownership is the cleanest proxy. According to the US Census Bureau’s American Community Survey (see census.gov), roughly 9 in 10 US households have access to at least one vehicle, but the share drops sharply in the handful of cities where quick commerce found any traction: more than half of households in New York City and a large majority in Manhattan have no car. That pattern repeats internationally: Istanbul, Mumbai, Shanghai and central London all combine high density with low car access per household, and those are the places where the model has held up longest. The car-heavy US suburb, where the sector spent a large part of its 2021 expansion money, combines low density with a strong substitute, and it is where the model collapsed fastest.
The “trip cost” a shopper is actually comparing
Pricing the shopper’s own trip makes the substitute concrete: in a car-first city the trip to a supermarket might take 15 minutes round trip, cost a dollar or two in fuel and involve no queuing to speak of at an off-peak hour. The shopper values that trip at close to zero, so a delivery fee plus a service fee plus a tip is a large premium for saving 15 minutes. In a dense transit city the equivalent trip means walking, carrying, and perhaps a queue at a small-format store with limited range, and shoppers routinely value that at $5–10 of their own time. The fee that looks extortionate in the first city looks like a bargain in the second.
Existing grocery delivery is also a substitute
Quick commerce does not only compete with stores. In cities where a scheduled grocery delivery service with a full supermarket range is already mature, the incremental value of a 15-minute top-up shop is narrower, and the operator ends up fighting for the small emergency basket rather than the weekly shop. That is a real niche but a thin one. The broader economics of who actually makes money in scheduled grocery delivery are examined in the site’s coverage of how supermarket strategy is shifting in 2026, and the short version is that the incumbents’ store-based fulfillment gives them a cost advantage on large baskets that no dark store can match.
How do wages and rider supply set the cost floor?
Labor is the largest variable cost in the model, and it varies by an order of magnitude between cities. Data from the US Bureau of Labor Statistics (bls.gov) put typical hourly earnings for delivery and courier roles in major US metros in the high teens to low twenties in dollars once minimum wage rules and any app-worker pay standards are applied, and New York City’s rule setting a minimum pay rate for app-based delivery workers, which the city’s Department of Consumer and Worker Protection administers, pushed the effective floor higher still. In Istanbul or Mumbai the fully loaded cost of a rider hour is a small fraction of that figure, according to sector reporting.
What matters for the model is cost per drop, which is the rider’s hourly cost divided by drops per hour. A rider costing $22 an hour who completes four drops an hour costs $5.50 per delivery before any packing labor or overhead; at two drops an hour that becomes $11. A rider costing the equivalent of $3 an hour who completes three drops costs $1 per delivery. That is why an Indian operator can offer near-free delivery on a $6 basket and remain within reach of contribution margin, while a New York operator needs a $30 basket plus fees to get to the same place.
Rider supply is as important as rider cost
A city can have low wages and still fail if it cannot supply enough riders at peak. Quick commerce demand is spiky: the dinner-hour rush and weekend evenings can run at three to four times the mid-afternoon rate, and the promise breaks the moment the store runs out of riders. Cities with a large existing pool of gig couriers, established two-wheeler culture and flexible labor rules can flex up cheaply. Cities where riders must be employed on fixed shifts, or where the courier pool is small, force the operator to carry idle labor through the trough to guarantee the peak, and idle labor is the most expensive thing on the P&L.
How do basket value and fees change customer behavior?
Every dollar of cost per drop has to be paid by someone, and the fourth variable is who. Contribution margin on a quick commerce order is the sum of product gross margin, delivery fee, service fee and any advertising or supplier income, minus picking, packing, rider cost, packaging and payment fees. Product gross margin on a grocery basket is typically in the 25–35 percent range for a convenience-oriented assortment, so on a $20 basket the operator earns perhaps $6 in gross margin before delivery costs. If the delivery costs $8 to execute, the order loses money before fees, and the fee has to bridge the gap.
The problem is that fees change behavior. Raise the delivery fee from $1.99 to $4.99 and order frequency falls, which reduces order density, which raises cost per drop, which requires a higher fee. This is the spiral that ended most Western pure-plays once venture subsidies were withdrawn, and the only ways out are a larger basket, so that gross margin covers more of the drop cost, or a lower drop cost, which is a density and wage question. Cities where the average basket is naturally large, because households are bigger or because the operator can sell higher-margin categories, have far more room to absorb a fee increase without collapsing frequency.
| Scenario | Basket value | Gross margin (30%) | Cost per drop | Fees collected | Contribution per order |
|---|---|---|---|---|---|
| Dense transit city, high wage | $32 | $9.60 | $6.50 | $3.50 | +$6.60 |
| Dense transit city, high wage, small basket | $18 | $5.40 | $6.50 | $3.50 | +$2.40 |
| Suburban US metro, high wage | $24 | $7.20 | $11.00 | $3.50 | −$0.30 |
| Suburban US metro, small basket | $15 | $4.50 | $11.00 | $3.50 | −$3.00 |
| Dense low-wage megacity | $7 | $2.10 | $1.00 | $0.40 | +$1.50 |
| Mid-density European city, employed riders | $22 | $6.60 | $8.50 | $2.50 | +$0.60 |
The figures above are illustrative modeling, not reported results from any named operator; they exclude store fixed costs, packaging, payment processing and marketing, all of which push the break-even point higher. The point of the table is the pattern: the dense, high-wage scenario stays positive even with a smaller basket, the suburban scenario goes negative even with a decent basket, and the low-wage megacity clears the bar on tiny baskets because the drop cost is trivial.
The discounter effect on basket size
Basket value is also shaped by the local grocery market’s price level. In markets where hard discounters have set consumer expectations for low prices, a dark store carrying branded convenience products at a markup looks expensive on every line, and shoppers use it only for emergencies. The discount grocer playbook, examined in how Aldi and Lidl built the discount model, is precisely a strategy for making the store trip cheap enough that no delivery premium can compete on a planned shop. Where that playbook dominates, quick commerce is confined to the top-up occasion.
What does rent per square foot do to the dark store footprint?
The fifth variable is real estate. A dark store is typically 2,000–5,000 square feet of ground-floor or basement space with vehicle access and a power supply that can run chilled and frozen storage. In a dense city the operator needs many of them to cover the map, and each one sits in a neighborhood where retail and light-industrial rents are high. In a sprawling city the operator needs even more stores to cover the same population, each of which serves fewer households, and the rent per store is lower but the rent per order is worse.
The interaction with density is what makes rent tolerable or fatal. A store paying a high central-city rent that processes 400 orders a day is spending well under a dollar per order on real estate. A store paying a third of that rent in a suburb but processing 60 orders a day is spending several dollars per order. The high-rent city is cheaper per order, because the store’s purpose is throughput, not floor space, and this is the same logic that governs whether a grocer should build micro-fulfillment inside existing stores or stand-alone dark stores, and the operational detail of running the latter is set out in dark store operations: layout, pick paths and staffing.
Zoning and site availability
Rent is only part of the property question. Several European cities, Amsterdam and parts of Paris among them, moved to restrict or freeze new dark store openings in residential areas from 2022 onward on the basis of noise, rider congestion and the loss of active retail frontage. The rules differ by municipality and have changed since, so they need checking locally, but the general effect was to constrain the site pipeline at exactly the moment operators needed to densify. A market where the operator cannot get enough stores in the right places cannot reach coverage, and coverage is what drives adoption.
The incumbents’ rent advantage
Supermarket chains already pay for space in every neighborhood they trade in, which means their marginal rent for an in-store quick pick operation is close to zero. That is a structural advantage no pure-play dark store network can replicate, and it explains why the second wave of rapid grocery in Europe and North America has been led by grocers bolting a fast option onto existing stores rather than by venture-backed newcomers. The competitive positioning of the large US grocers on this front is part of the broader picture in Kroger versus Walmart for grocery in the US, where store density and existing delivery infrastructure decide who can offer a fast slot cheaply.
Which cities have worked and which have collapsed?
The sector’s track record maps onto the five variables with unusual clarity. The table below groups representative cities by the outcome the industry has reported, with the caveat that operator results are rarely disclosed at city level and much of what is public comes from company statements, investor updates and press reporting rather than audited figures. Treat it as an evidence-weighted pattern, not a ranking.
| City or market | Density | Car access | Rider cost | Typical basket | Reported outcome (as of 2026) |
|---|---|---|---|---|---|
| Istanbul | Very high | Low per household | Low | Small | Home market where Getir has continued operating after withdrawing from Western Europe, per company statements |
| Mumbai, Bengaluru, Delhi NCR | Very high | Low | Low | Small, rising | Sustained growth for Blinkit, Zepto and Swiggy Instamart, with dark store counts expanding through 2025 according to company filings and reporting |
| Shanghai, Beijing | Very high | Low to moderate | Low to moderate | Small to medium | Long-established rapid grocery from Meituan, Dingdong and others; consolidation but continued operation |
| Manhattan and inner Brooklyn | Very high | Very low | Very high | Medium | Only US area where multiple pure-plays reached meaningful scale; Buyk and Fridge No More shut in 2022, Gopuff and DoorDash-linked services continue |
| Central London | High | Low | High | Medium | Pure-plays consolidated or exited; grocer-led services such as Tesco Whoosh and Deliveroo partnerships continue |
| Berlin, Amsterdam | Moderate to high | Low to moderate | High, employed models | Medium | Gorillas absorbed by Getir in 2022; Getir later exited; Flink continues in parts of Germany and the Netherlands |
| US Sun Belt suburbs (Phoenix, Dallas, Atlanta) | Low | Very high | High | Medium | Widespread withdrawals in 2022–2023; rapid delivery now offered mainly by grocers and marketplaces from stores |
| Chicago, Philadelphia cores | Moderate to high | Moderate | High | Medium | Mixed; pure-play footprints reduced, store-based rapid options from grocers and Amazon expanding per company announcements |
Two patterns stand out. First, every market in the “sustained” group combines very high density with low car access and low rider cost, and every market in the “collapsed” group misses at least two of those three. Second, in the high-wage Western cities that partially worked, the surviving form of rapid delivery is increasingly attached to a supermarket or a marketplace with other revenue, rather than a stand-alone dark store network. That shift is itself evidence: where the pure-play unit economics could not clear the bar, the model retreated into businesses that could absorb it as a feature rather than carry it as a company.
The US and India sit at the two ends of that spectrum. Outside a handful of urban cores the US is low density, car dependent and high wage, and its consumers were trained by years of subsidized delivery to expect fees near zero; operators that launched nationally in 2021 spent most of their capital in cities where the model could not work. India offers the mirror image, with dense cores, low car ownership, an inexpensive two-wheeler rider pool and consumers not yet locked into a weekly supermarket habit, which is why tiny baskets there were never the problem.
How can a new market be scored before launch?
The variables above can be turned into a practical scoring sheet. The aim is not precision, which the data will not support before launch, but a disciplined way to compare candidate cities and to force an honest answer on the one or two dimensions that most often get waved through in a growth plan. Each variable is scored from 1 to 5, and the total is read against a threshold rather than optimized.
| Variable | What to measure | Score 1 (weak) | Score 5 (strong) | Suggested weight |
|---|---|---|---|---|
| Population density | Residents per square mile inside a one-mile catchment of candidate sites; share of housing in multi-unit buildings | Under 5,000 per sq mi; mostly detached homes | Over 40,000 per sq mi; predominantly apartment blocks | 30% |
| Substitute strength | Household car access; distance to nearest full-range supermarket; maturity of scheduled grocery delivery | Over 85% of households with a car; supermarket within a 5-minute drive | Under 40% with a car; no full-range store within a 10-minute walk | 20% |
| Rider cost and supply | Fully loaded cost per rider hour; size of existing courier pool; contractor versus employee rules | Over $20 per hour; employed model required; thin courier pool | Under $5 per hour equivalent; large flexible gig pool; two-wheeler culture | 20% |
| Basket and fee tolerance | Average local grocery basket for a top-up shop; existing consumer acceptance of delivery fees; discounter share of grocery | Basket under $15; fee expectation near zero; discounters dominant | Basket over $30 or very low drop cost; fees of $3–5 accepted | 15% |
| Real estate | Rent per square foot for suitable ground-floor space; number of sites needed for coverage; zoning restrictions on dark stores | High rent per order at realistic volumes; dark store restrictions in force | Rent under 5% of projected order value; sites available in every target neighborhood | 15% |
A weighted score of roughly 3.8 or above out of 5 describes a market where the model has historically been sustained; scores between about 3.0 and 3.8 describe markets where it has worked only as a feature attached to a larger retailer; and scores below 3.0 describe the markets that were exited. The thresholds are calibrated by eye against the outcomes in the previous section, so they should be treated as a starting rule of thumb to be revised as an operator collects its own data.
How to use the sheet honestly
The most common failure in applying a framework like this is scoring the city as a whole rather than the specific neighborhoods a store network would serve. Almost every major city has a dense core that scores well and a periphery that does not, and the temptation is to launch on the core’s score and then expand into the periphery on the strength of brand momentum. That is the sequence most failed operators followed, and a more useful discipline is to score each candidate dark store catchment separately and to accept that a viable market may be only a fraction of a city’s map. The sheet also leaves out competitive intensity and regulatory drift, both of which can move a market by a full point in a single funding round or ordinance, and the incumbent grocers’ response, which can close the convenience gap at a marginal cost no newcomer can match.
What does this mean for the next wave of rapid grocery?
The city-economics lens suggests the next phase of rapid grocery will diverge by place rather than converge on one global model: pure-play dark store networks in dense, low-wage megacities, a hybrid fast lane inside supermarkets or marketplaces in dense high-wage cores, and store-based rapid options from incumbent grocers in car-first metros, where the stand-alone dark store is unlikely to return.
For retailers judging whether to enter or partner, the practical implication is to reverse the usual order of analysis. Rather than starting with the app, the assortment or the brand, start with the map: score the catchments, price the rider hour, measure the substitute and only then decide what kind of rapid offer the city can actually carry. The economics of the model as a whole are laid out in the site’s guide to quick commerce, dark stores and rapid delivery, and the wider competitive context for grocers and other physical retailers is covered in the state of retail: department stores, grocers and experiences. The sector’s lesson is not that rapid grocery does not work, but that it works in specific places, for reasons that can be measured before the first dark store is leased.
FAQ on city-level quick commerce economics
What population density does a dark store need to be viable?
There is no single published threshold, but the markets where the model has been sustained generally exceed 25,000–40,000 residents per square mile within the delivery catchment, with most housing in multi-unit buildings. Suburban densities of 2,000–5,000 per square mile have not supported stand-alone dark stores in any reported case, though grocers serve those areas from existing stores.
Why did quick commerce fail in most US cities but survive in Manhattan?
Manhattan combines extremely high density, majority car-free households and vertical housing that lets riders complete multiple drops per stop, which offsets very high labor costs. Most other US metros are low density and car dependent, so the operator’s cost per drop is high and the customer’s alternative is a cheap, fast drive to a supermarket.
How much does rider cost per hour change the economics?
Rider cost is the largest variable cost per order. A rider at $22 an hour completing three drops costs over $7 per delivery, while a rider at the equivalent of $3 an hour completing the same drops costs $1. That difference alone explains why a $7 basket can work in Mumbai and a $20 basket can lose money in Dallas.
Does a larger basket fix the model in a low-density city?
Only partially. A larger basket raises gross margin per order, but low density keeps drops per rider hour low, so the cost per delivery stays high, and it also reduces the number of orders a store can pull, which leaves fixed costs uncovered. Basket size helps most where density is already adequate.
Why do supermarkets have an advantage over pure-play dark stores?
They already pay for space and inventory in every neighborhood they trade in, so the marginal cost of adding a rapid pick-and-deliver option is far lower than building a dark store network from scratch. They also have larger average baskets and existing delivery customers, which is why the second wave of rapid grocery in Western markets has been grocer-led.
How do delivery fees affect order frequency?
Raising fees reduces frequency, which lowers order density and raises cost per drop, which in turn pressures the operator to raise fees again. Markets with high fee tolerance or naturally large baskets can absorb the increase; markets trained on subsidized near-zero fees generally could not, which is what ended most Western pure-plays once venture funding tightened.
Do dark store zoning rules matter to city viability?
Yes. Several European municipalities restricted new dark stores in residential areas from 2022 onward, which limited the number of sites operators could open and therefore the coverage they could reach. Rules vary by city and change over time, so they need to be checked at the municipal level before scoring a market.
Is the scoring sheet in this article a substitute for a launch model?
No. It is a screening tool for comparing candidate cities and neighborhoods before detailed modeling, and its thresholds are calibrated against historical outcomes rather than derived from any operator’s audited data. A launch decision should rest on catchment-level order density assumptions, local labor cost and a store-level P&L.